I just upgraded our metabase to v0.33.2, and I find there is some problem with line chart.
I have a table with 3 columns:
create table metabase_issue(page string, week string, pv int);
insert into metabase_issue values('p1','w1',5),('p1', 'w2', 9),('p2','w1',6),('p2','w2',6);
I have a question select week, page, pv from metabase_issue;, and I want to use line chart with series 'page' and 'week' for our table, but I find it doesn't work correctly
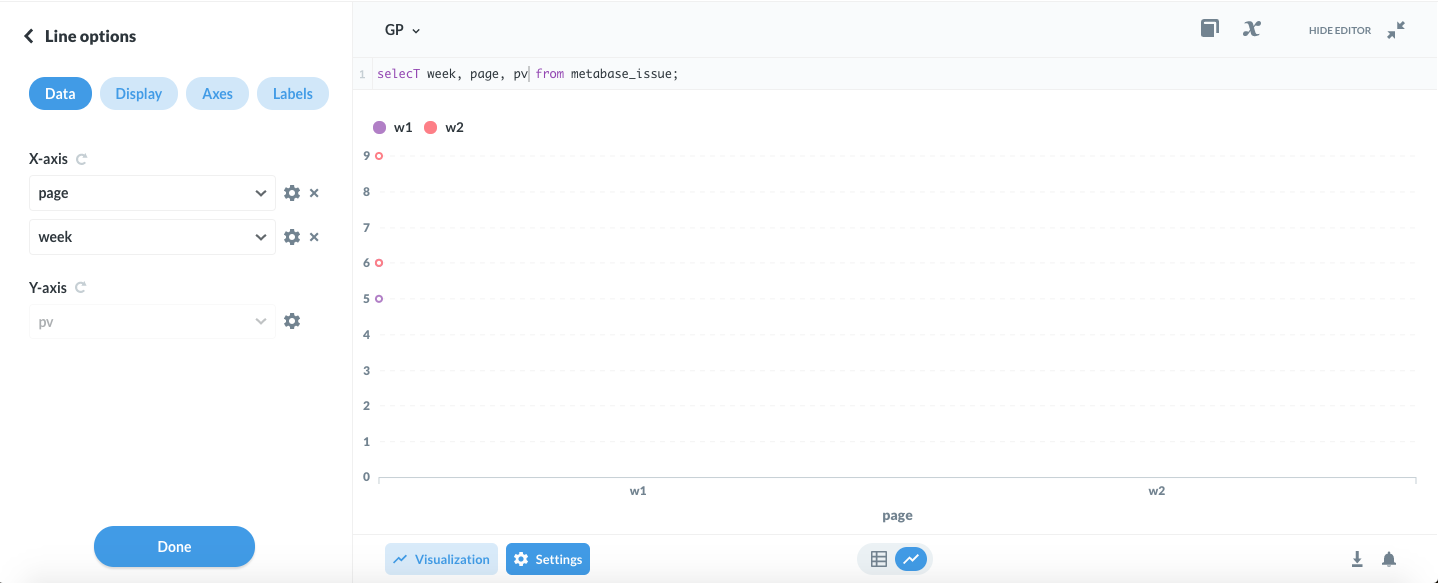
however, if I change the order of column in SQL to select page, week, pv from metabase_issue;, it can work correctly
I think this might be a issue, since I didn't have to specify the column in the same order as in line chart X-axis setting in previous version.
Any ideas?