We are facing issues when creating metabase charts.One is:
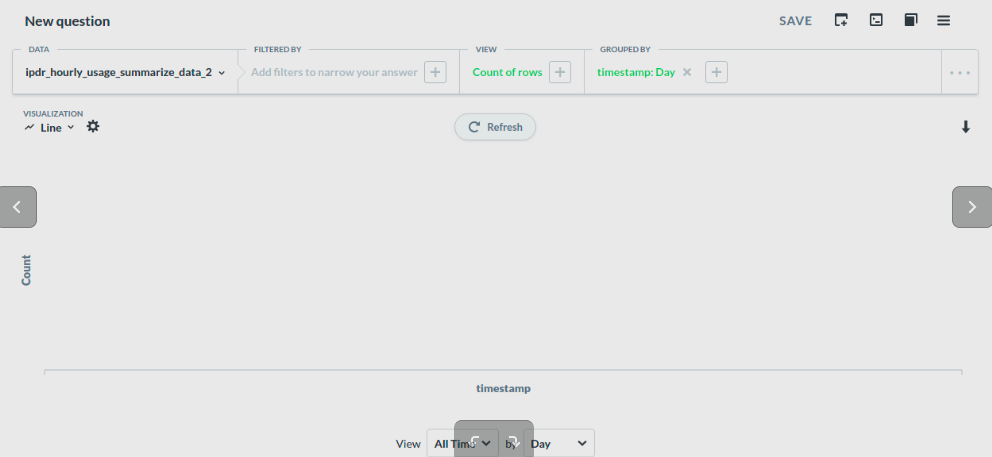
When creating line chart where x axis is Timestamp(Day) and y axis is count of rows the chart is not displaying.
The screenshot of this is below
But when we go to the particular chart's native query and click refresh it is displaying the chart.
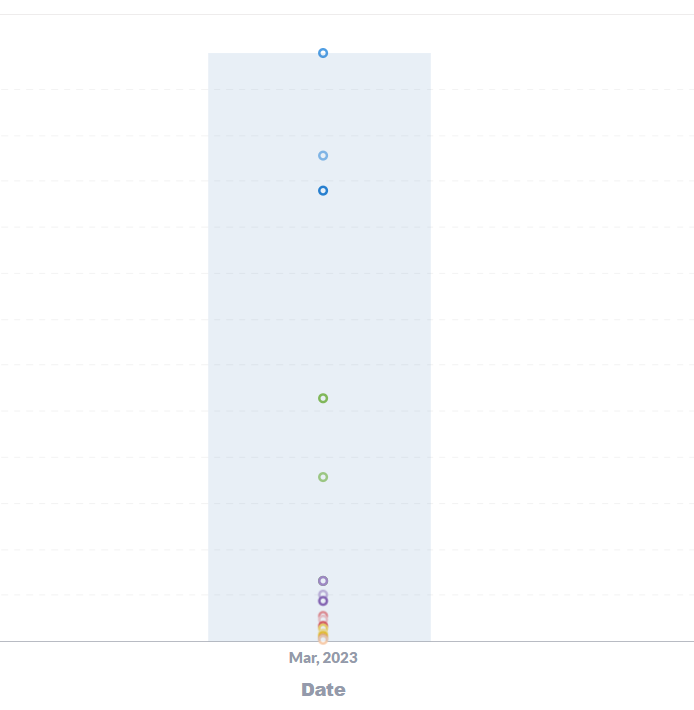
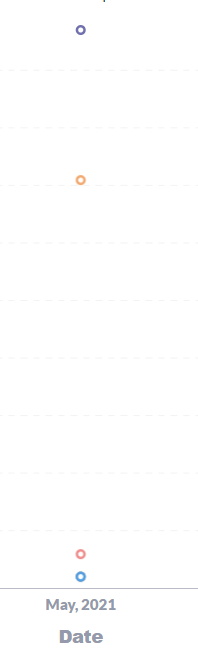
Hi there! I'm getting a similar type of issue. I've grouped the data by Timestamp (Month). I have data till date on my table. But it doesnot show the points for the months of May, April and March. But it shows for the month of Februaury. Only when dragged and selected it shows the data point.
version: 0.44.6
Diagnostic info
{
"browser-info": {
"language": "en-US",
"platform": "Win32",
"userAgent": "Mozilla/5.0 (Windows NT 10.0; Win64; x64) AppleWebKit/537.36 (KHTML, like Gecko) Chrome/113.0.0.0 Safari/537.36 Edg/113.0.1774.42",
"vendor": "Google Inc."
},
"system-info": {
"file.encoding": "Cp1252",
"java.runtime.name": "Java(TM) SE Runtime Environment",
"java.runtime.version": "11.0.6+8-LTS",
"java.vendor": "Oracle Corporation",
"java.vendor.url": "http://java.oracle.com/",
"java.version": "11.0.6",
"java.vm.name": "Java HotSpot(TM) 64-Bit Server VM",
"java.vm.version": "11.0.6+8-LTS",
"os.name": "Windows Server 2016",
"os.version": "10.0",
"user.language": "en",
"user.timezone": "America/New_York"
},
"metabase-info": {
"databases": [
"sqlserver",
"mongo"
],
"hosting-env": "unknown",
"application-database": "h2",
"application-database-details": {
"database": {
"name": "H2",
"version": "1.4.197 (2018-03-18)"
},
"jdbc-driver": {
"name": "H2 JDBC Driver",
"version": "1.4.197 (2018-03-18)"
}
},
"run-mode": "prod",
"version": {
"date": "2022-11-01",
"tag": "v0.44.6",
"branch": "release-x.44.x",
"hash": "5c6ae21"
},
"settings": {
"report-timezone": null
}
}
}
please upgrade to the latest version and see if this has been fixed. Also, it seems that you're running in a production environment with the file based databas (h2) as the app db. You need to migrate to a production grade database (postgres or mysql) ASAP
Thanks! Upgraded the version, but still the issue is not solved. Yes, we are running on h2 app db in our development environment. Is this migration related to this line chart issue?
No, this is not a db issue. Can you check the underlying data that Metabase has to render?
Getting the same issue for the last 3 months alone. When I give May 2021, it immediately shows up. But for May 2023 it doesn't show up immediately but data is there. Only on dragging and selecting it shows up.