I have been fiddling with the query editor and visualisation settings and am pretty sure this can't be done. Just posting it here to make sure.
The database has a list of articles and their sources. The goal is to find out if there aren't any new records for a given source in the last 7 days, for example.
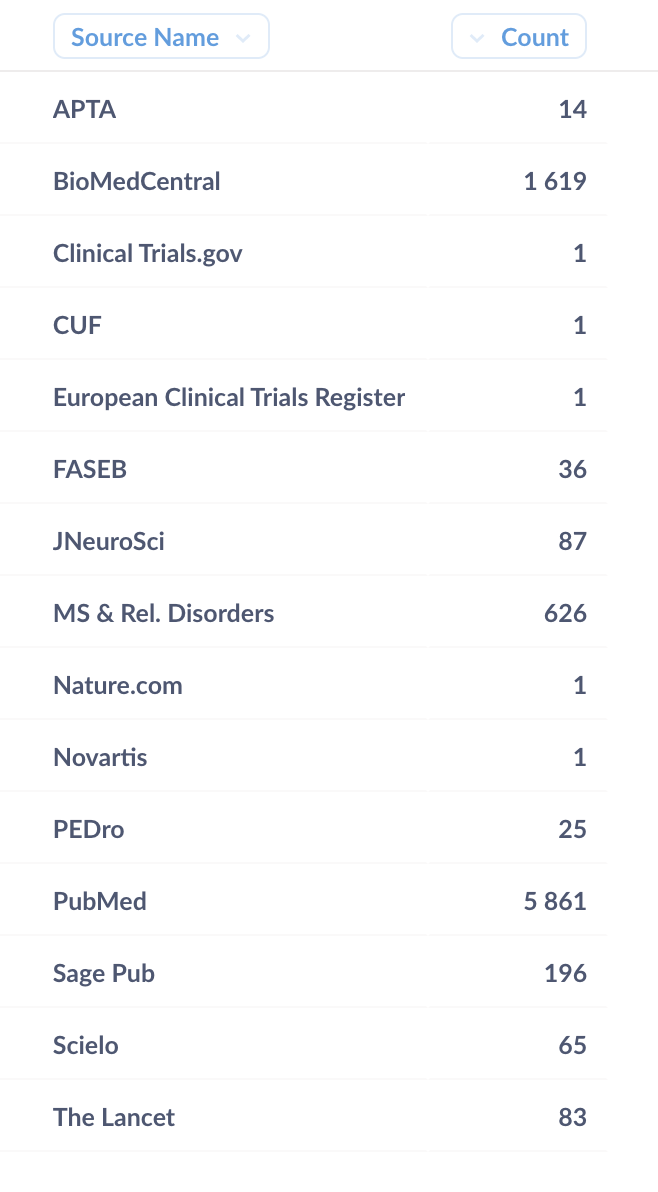
Unfiltered, it looks like the table below or as a chart listing all the sources.
Hi @brunoamaral
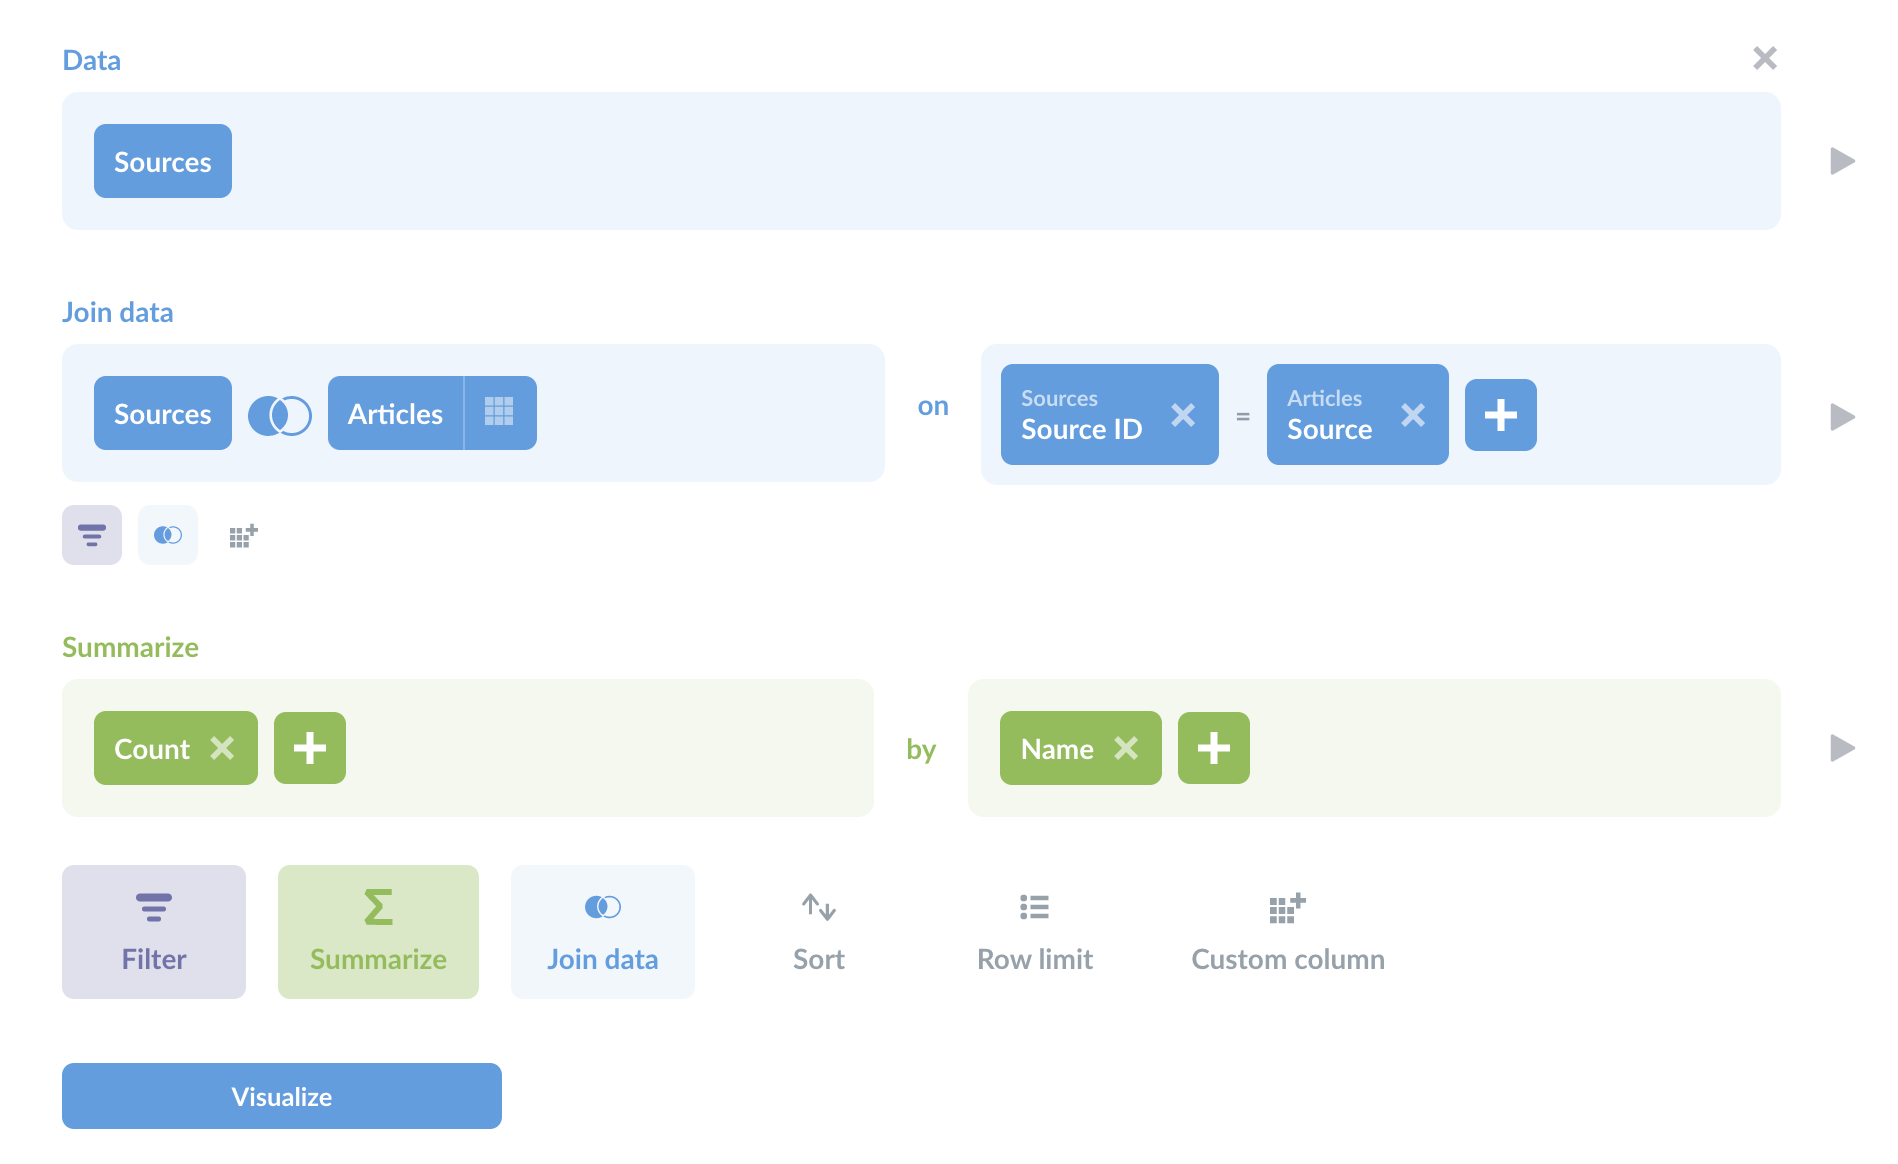
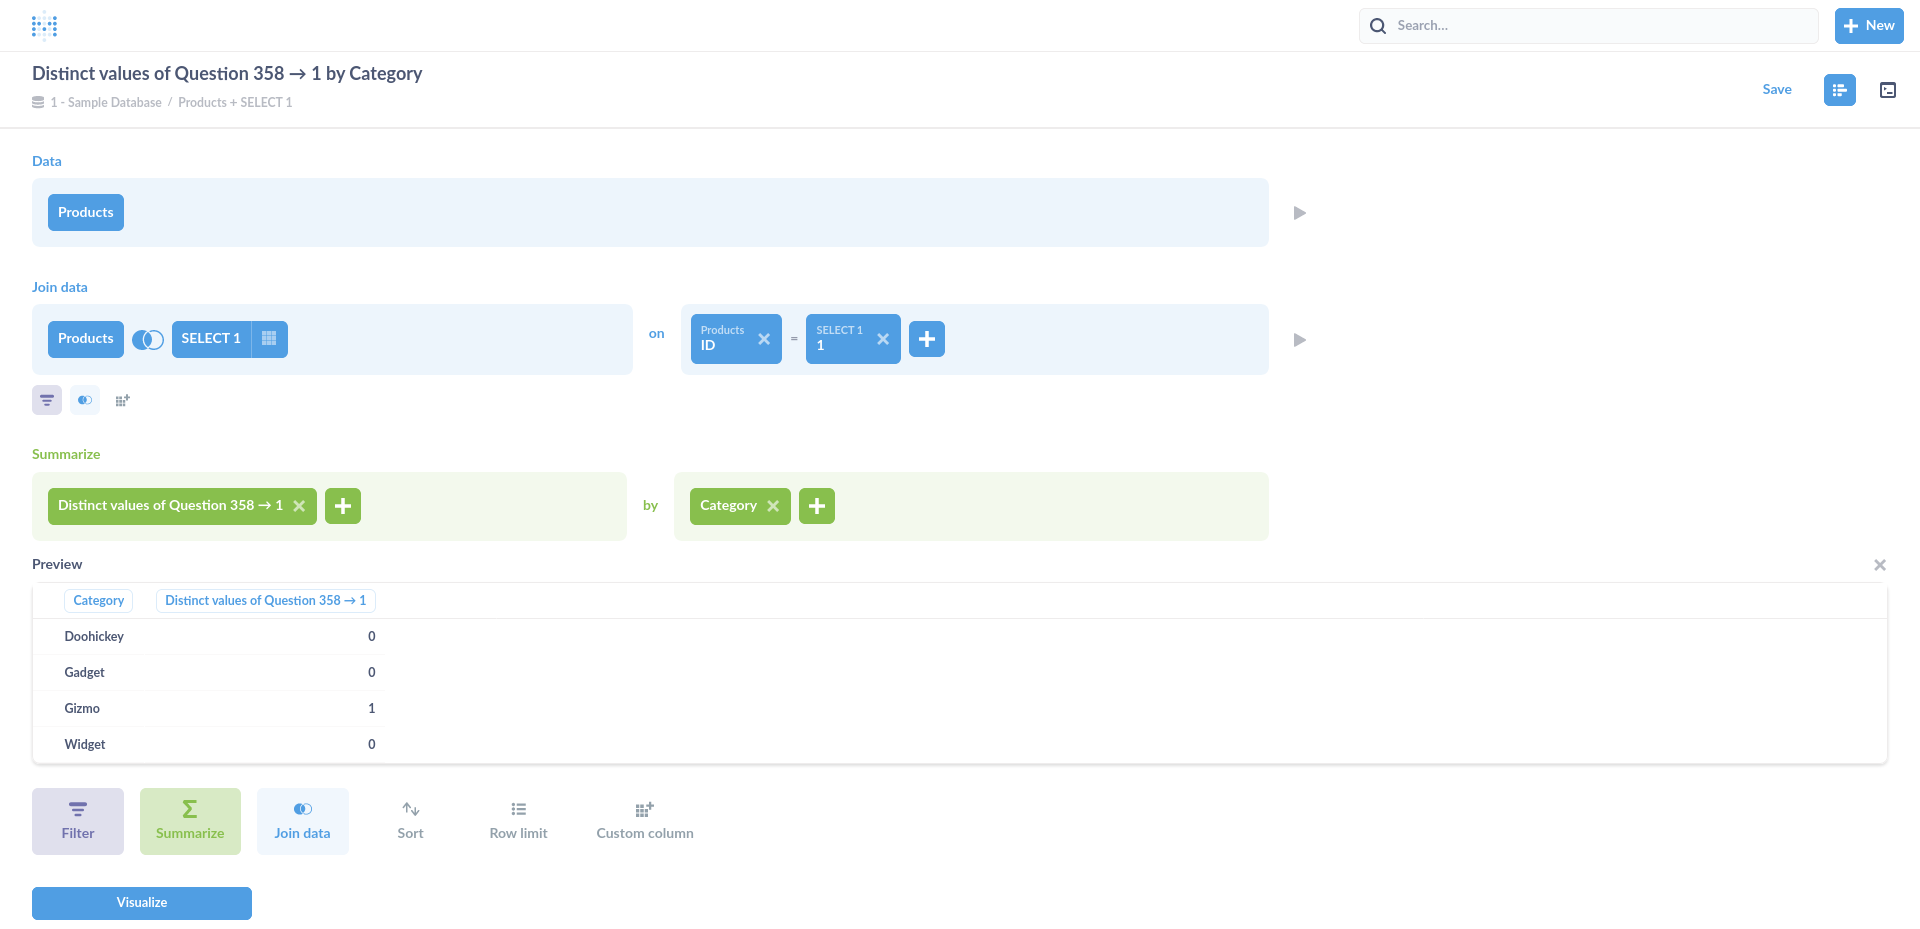
If you have an Articles.ID column, then instead of using Count, then use "Number of distinct values" of that column. If you cannot make it work like that, then use SQL instead, so you have better control.
Example:
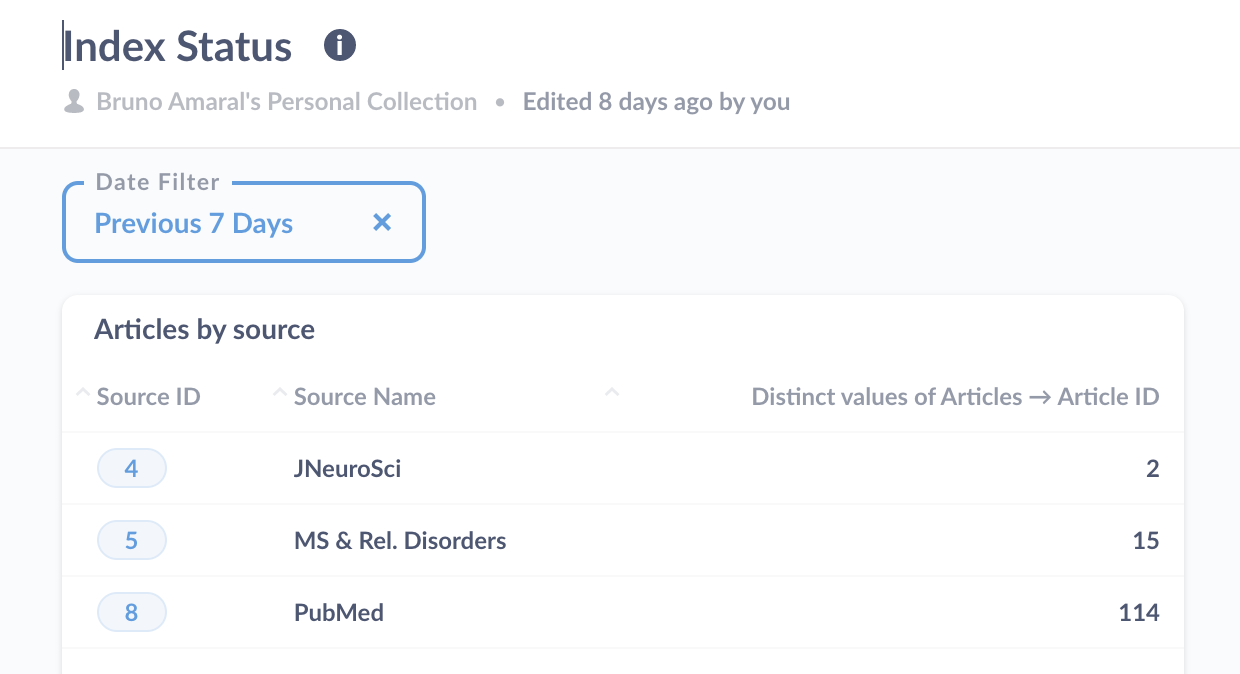
Thank you @flamber, that does work but breaks, expectedly, when I add the filter for the last 7 days. I'll look into building it as a SQL Query like you suggest.
@brunoamaral What breaks? It sounds like you want to create a separate question, which only filters Articles the last 7 days, then you create a question with Source as based joining in the Article question.
Looking back I wasn't clear about what I am trying to do.
My system collects data from several sources, sometimes one of them breaks. I need to a way of knowing if a certain source hasn't been giving back results in the last few days.
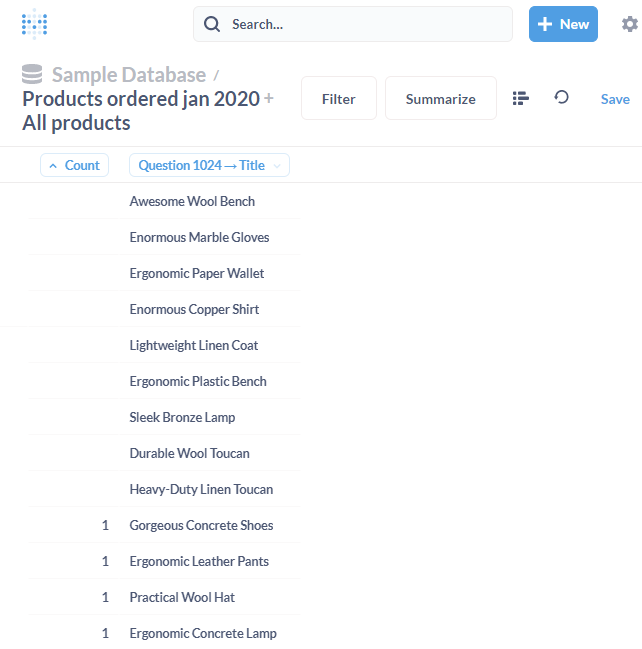
The current solution shows the ones that return results, but excludes sources with a count of zero.
This can be done with the query builder and no SQL queries. You need 2 things.
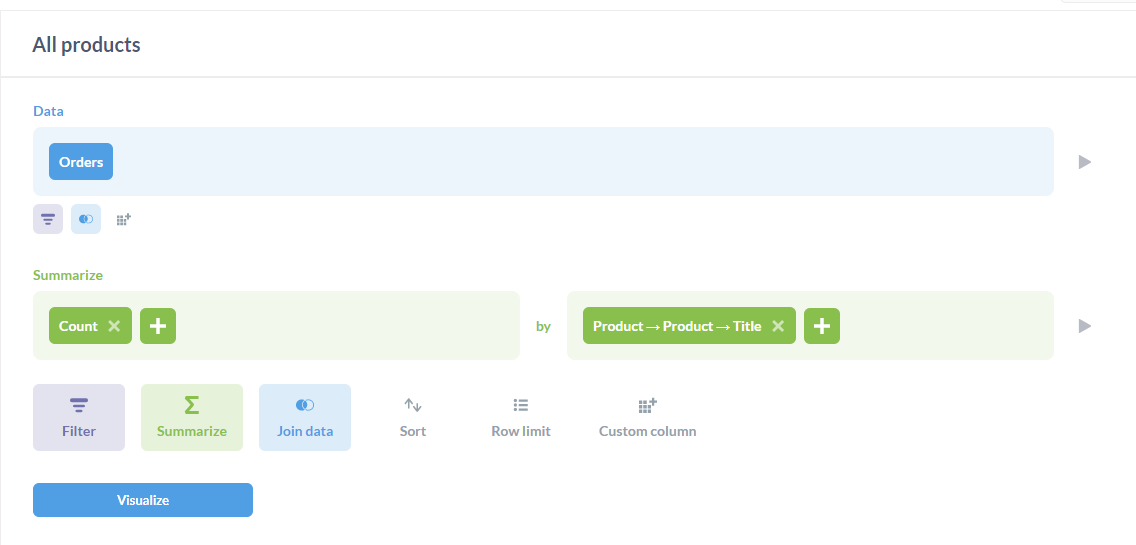
1 - a list of all the types in the data
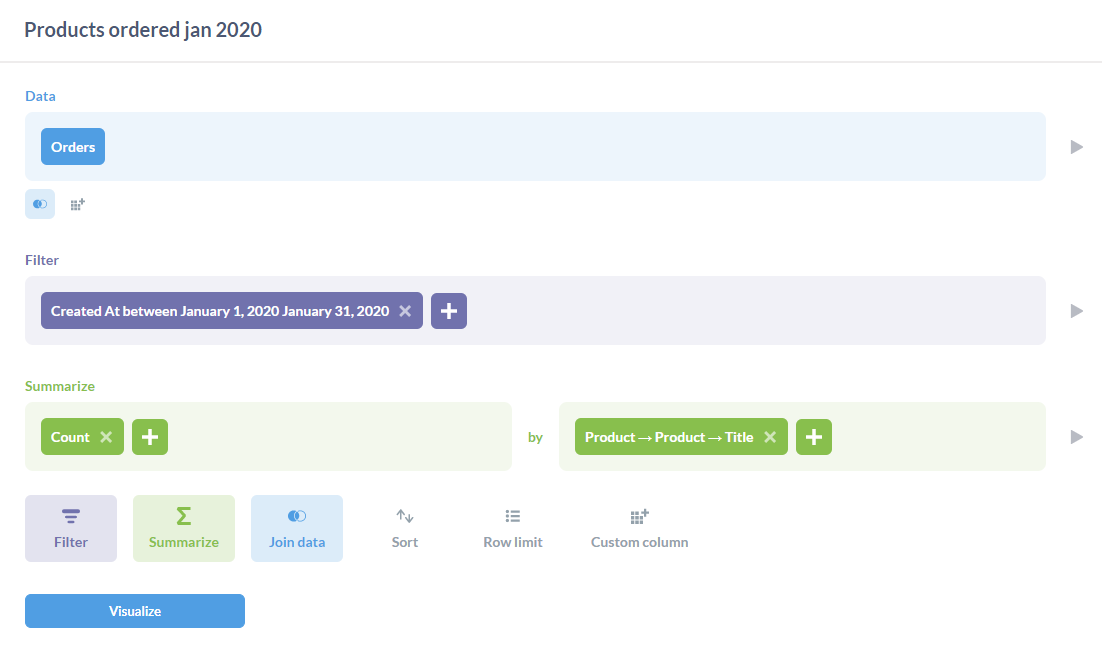
2 - a count of each type for the period of interest
If you don't have (1) as a separate lookup table, you can create it as a subquery, in Metabase that's a saved question.
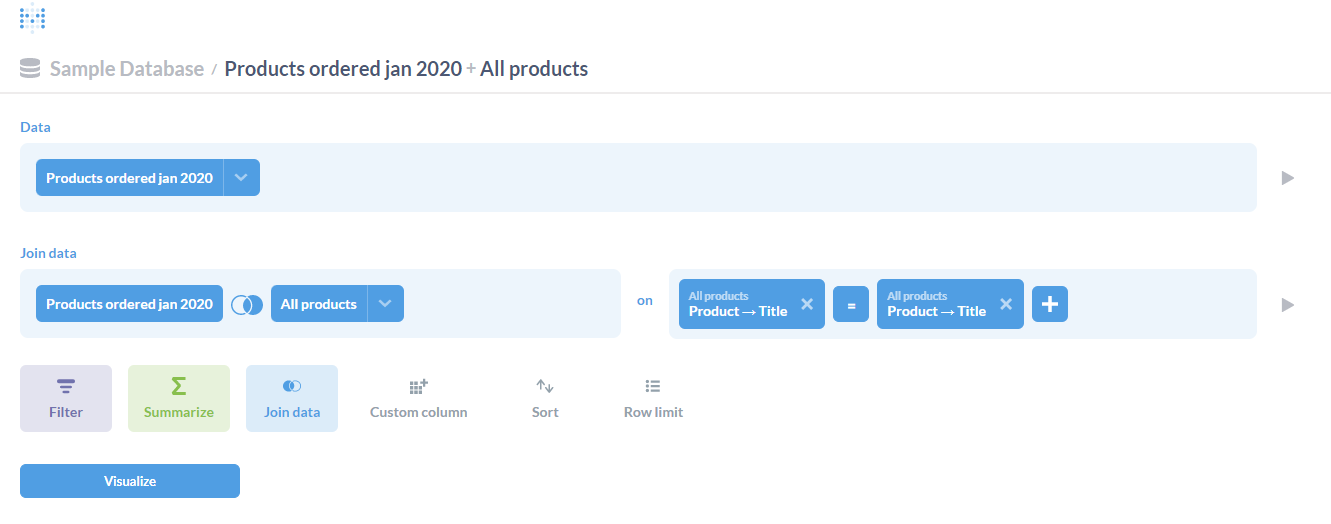
Create a new question, starting from saved question (2). Join saved question (1), make sure it's a right outer join, this means you'll get a row in the result for every row in (1). You can start the query from either dataset, just change the join type as appropriate.
Personally I think it would be better if Metabase would let you build these subqueries explicitly in the query builder without having to create yet another saved query, but we use the tools we've got.
I'm either missing a step or what I'm after is just enough different that I can't make it work. Here is my situation. I basically have a table of items that people complete (Table 1). I want to track their month over month progress. So I created Table 2 as a temp table that takes the current date and gives you the first of that month, then counts back X number of months (Table 2). So in this example, I'm looking at the past 4 months and want to see every single month listed, whether it's zero or not, and the count be when the Resolution Date (by Month) equals the Calendar Date (by Month).
So Desired Outcome count would be for everyone in Table 1. Then if I filtered to a specific Assignee, I could get the 2nd Desired Outcome. My hope is for this format so I can visualize it as a month over month trend or bar chart.
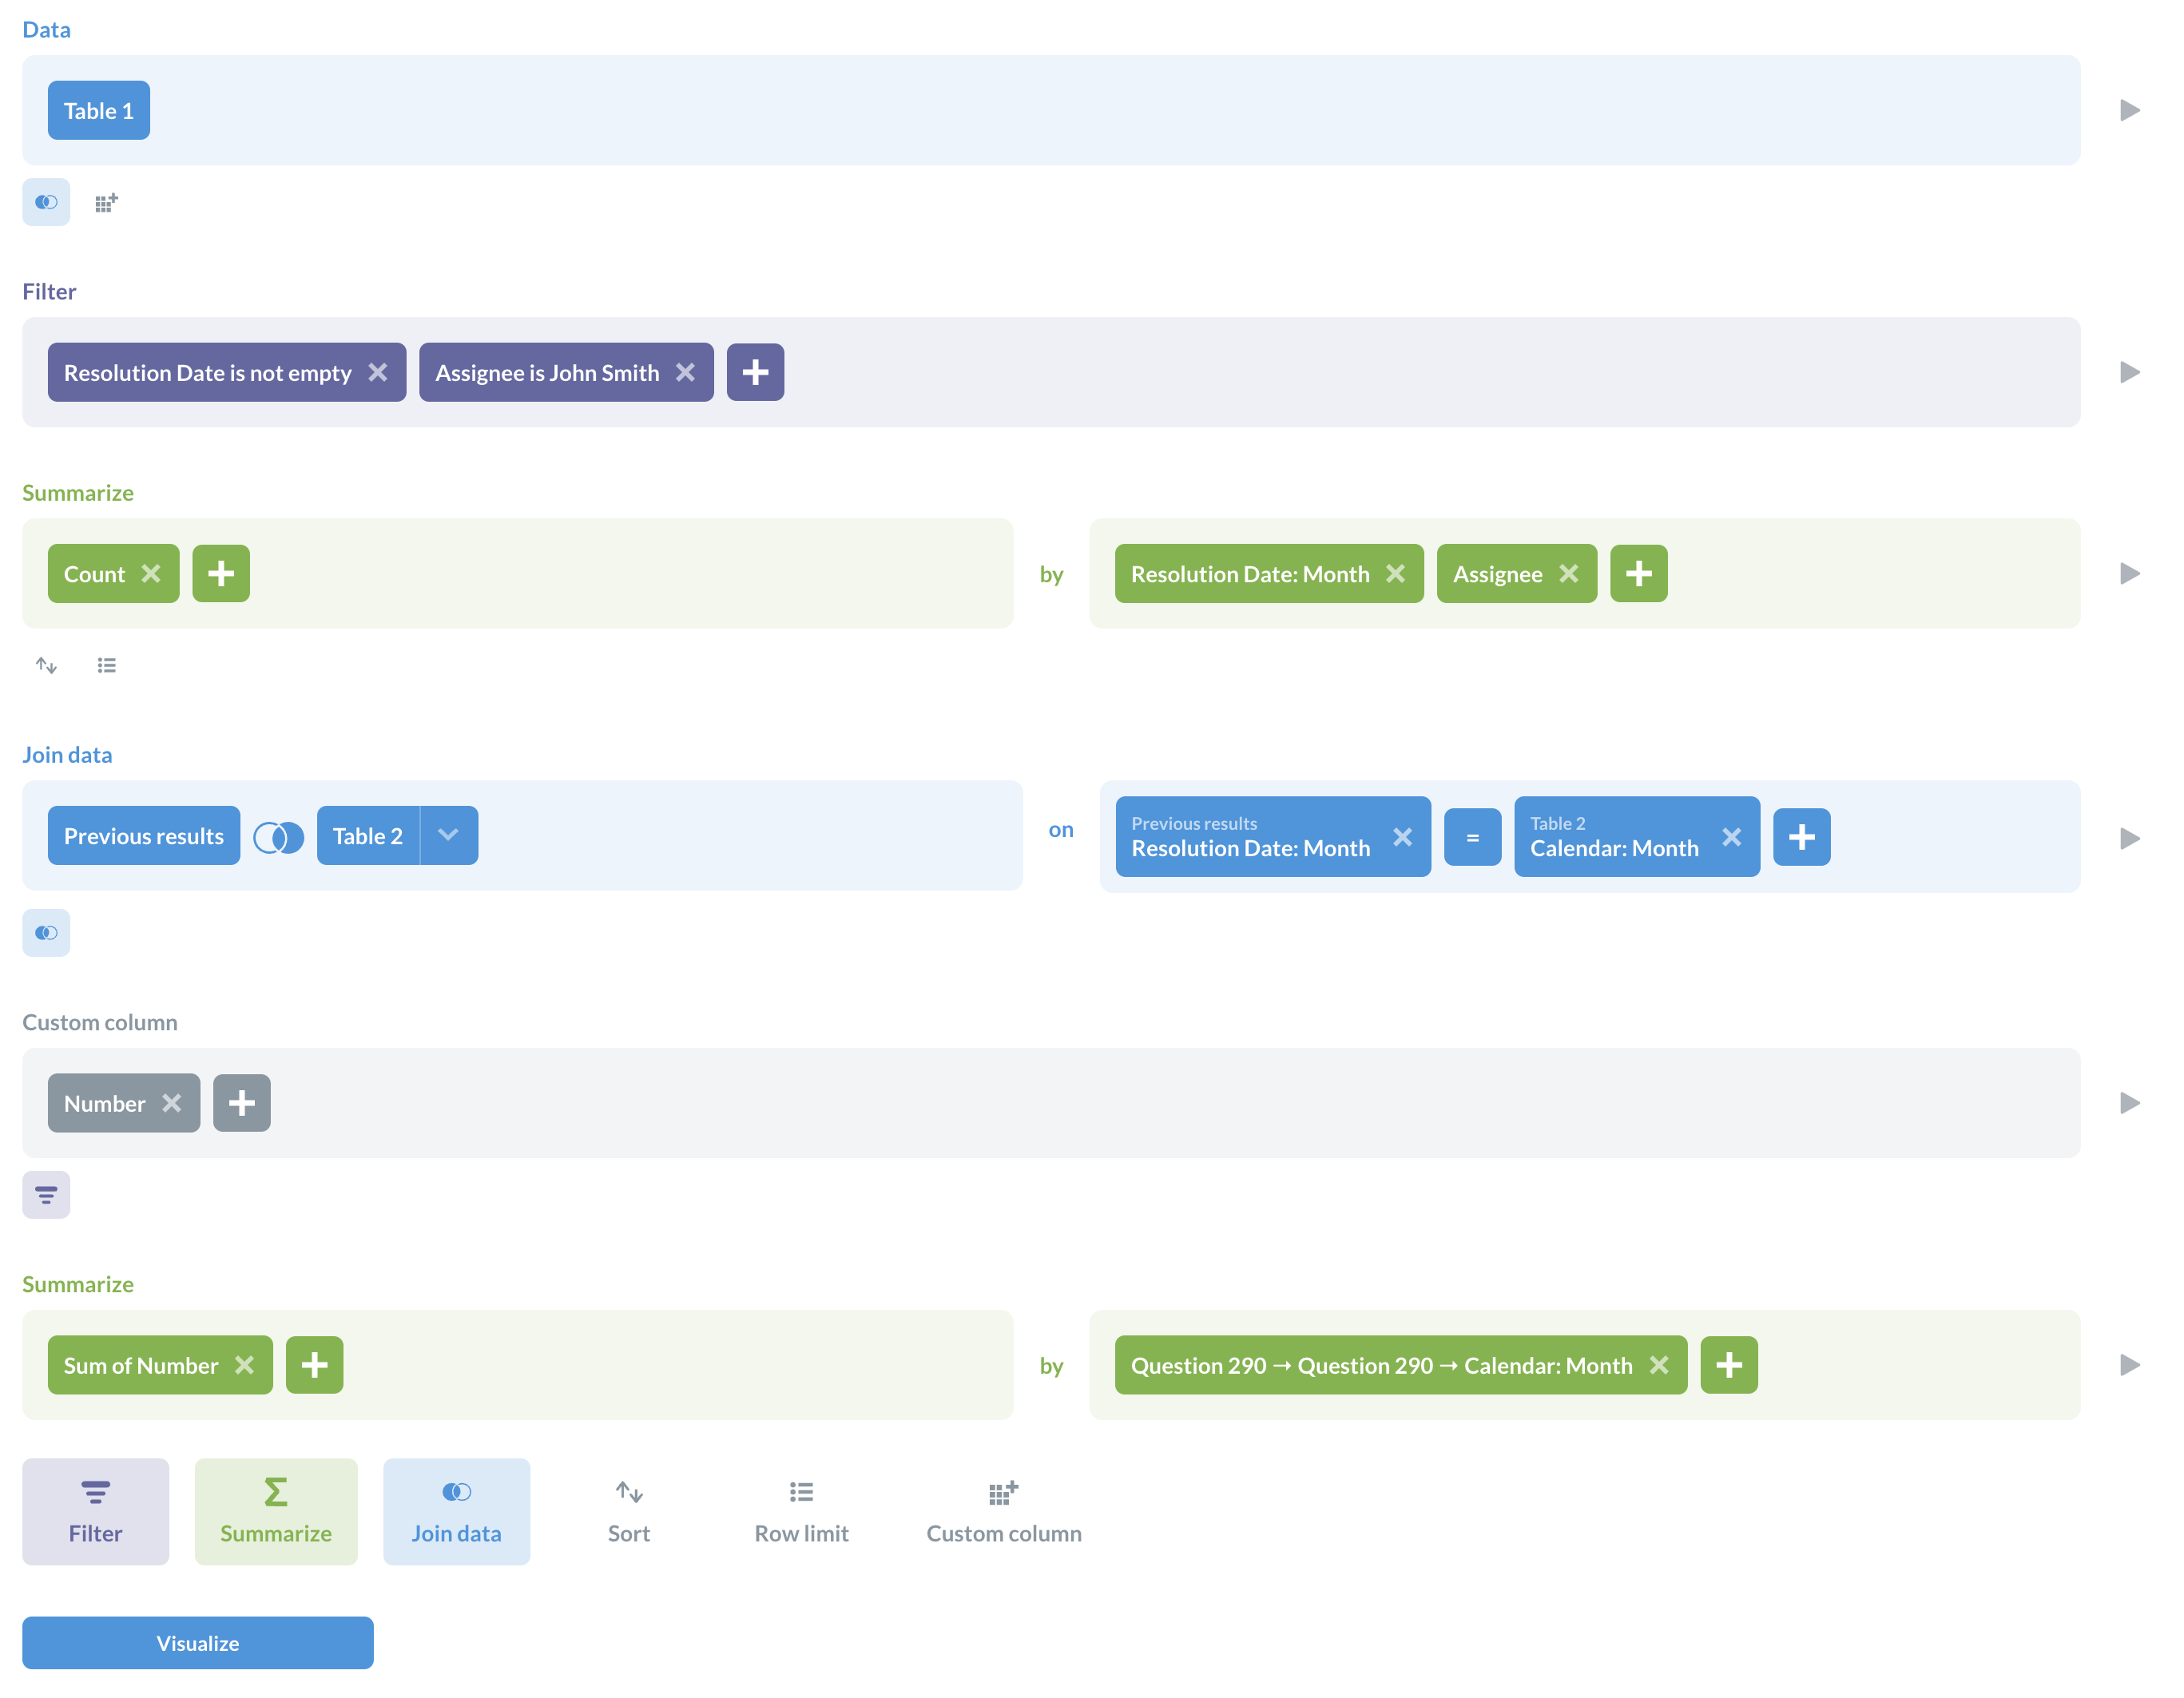
I think I got it working! Thanks for nudging me into some other ideas. Here is how I was able to set it up (using the tables mentioned in my previous comment).
The purpose of the Custom column called Number is because I want to see zero's, not just nulls. So this column value is coalesce([Count], 0) . So doing the summarize before the right join with the calendar allowed me to get the sum to work properly.
The only odd thing (that I can work around) is that I can sort the data so the current months are at the top instead of the bottom, however when applying the Trend visualization, it was only displaying from the oldest dates on the calendar first. So I just removed the sort and just look to the bottom of the list if I'm looking for the current month (though my main way of displaying this is a trend on a dashboard).
well. other bummer that I didn't notice until I added it to a dashboard. I can't use a dashboard filter because it ends up applying the filter as a new block between Custom column and the last Summarize block (instead of just adjusting the filters in the pre-existing filters section). This ends up removing the null/zero values so the results are now incorrect. So, may have to go back to the drawing board a bit to make it work in a dashboard scenario...
just to close out how I solved this for my needs. I built the question all in one question using the notebook editor. Then, converted to SQL and put the filter variable where I wanted it in the query so the dashboard filter would cooperate. Downside, it just means I have 2 questions instead of one. But can easily do anything in the notebook editor, then copy/paste to the SQL version of the question to update.