Issue Description:
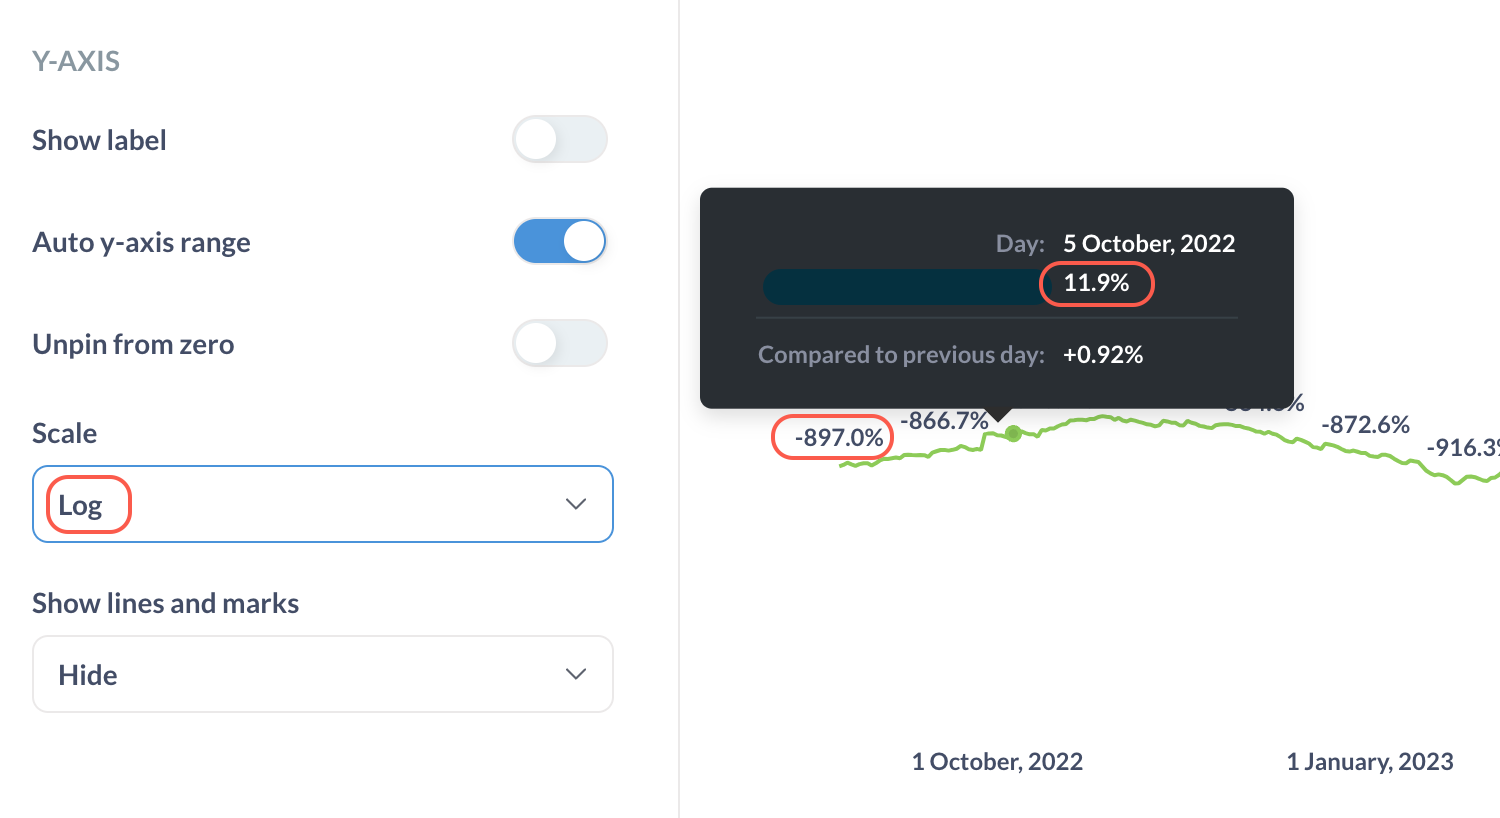
Since the start of July 2024, it has been observed that when selecting a Log scale for line charts, the values displayed are the log-transformed values of the 'real' data values. This behavior is inconsistent with the previous functionality and is confusing users.
Steps to Reproduce:
- Create a line chart with a dataset.
- Apply a Log scale to the y-axis.
- Observe that the values shown are the log-transformed values instead of the actual data values.
Expected Behavior: The chart should display the actual data values on a logarithmic scale, as was the behavior before July 2024.
Actual Behavior: The chart displays the logarithmic values of the data, leading to a misinterpretation of the information.
Possible Cause: This change may be related to the rollout of the "Unpin from zero" feature, which seems to have unintentionally altered the behavior of Log scale charts.