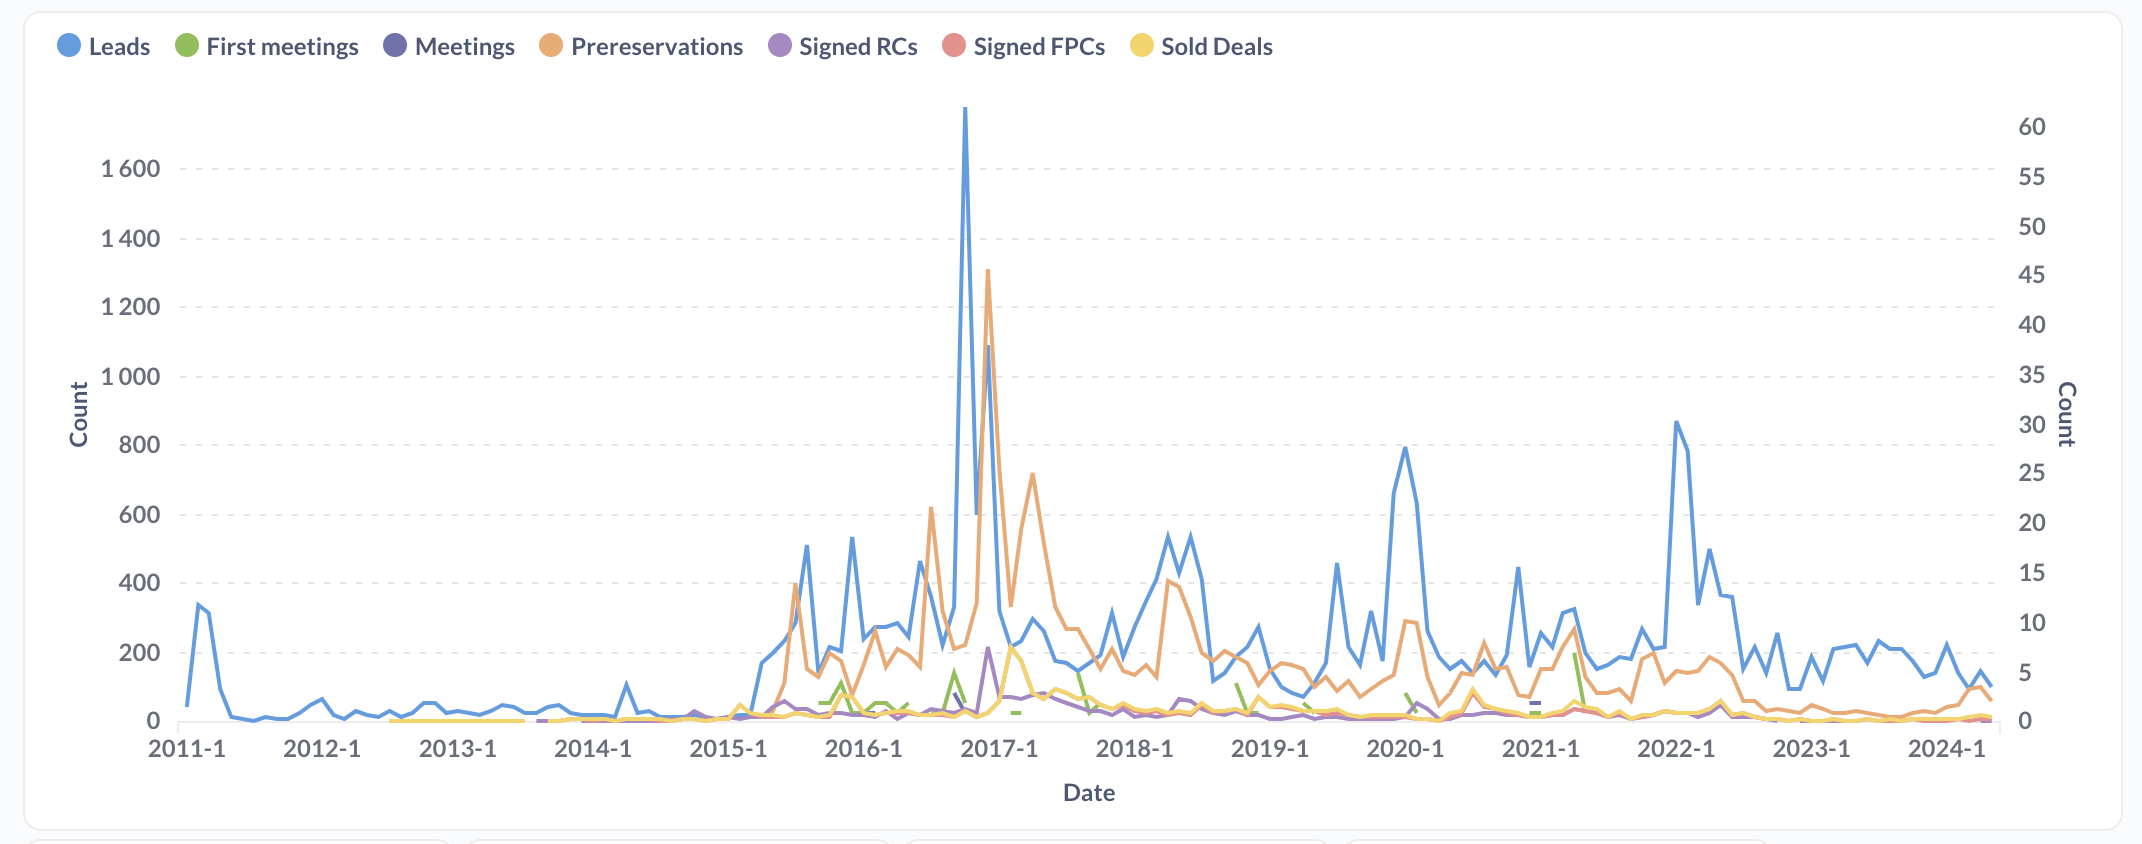
We have a bunch of Questions each grouping a certain metric by months. We combine them into a single Line Chart successfully, showing e.g. what value each of those Questions has on May 2024 or whatever.
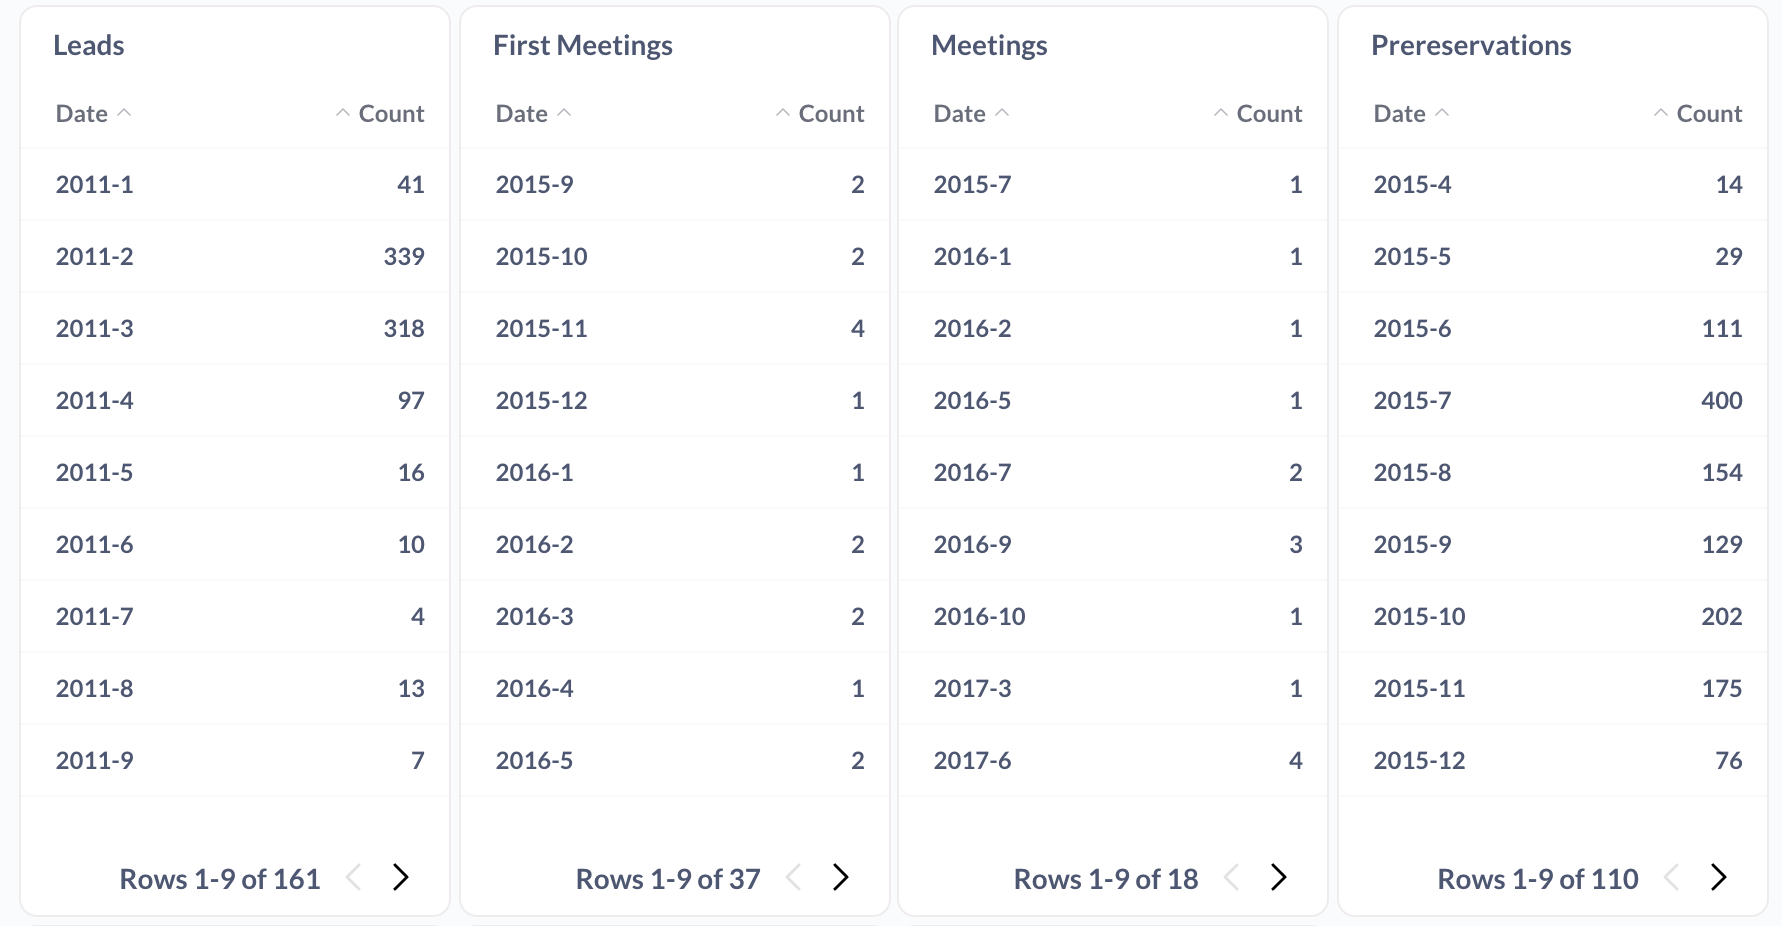
Now we'd like to have a Table showing the same data but explicitly: months in rows, each metric in its own column. Is this possible to achieve? What is the best practice?
The workaround I am using right now is to give each of the metrics its own narrow 2-column table with just the month and the value of the metric. Which looks very bad of course, and does not align on the months.
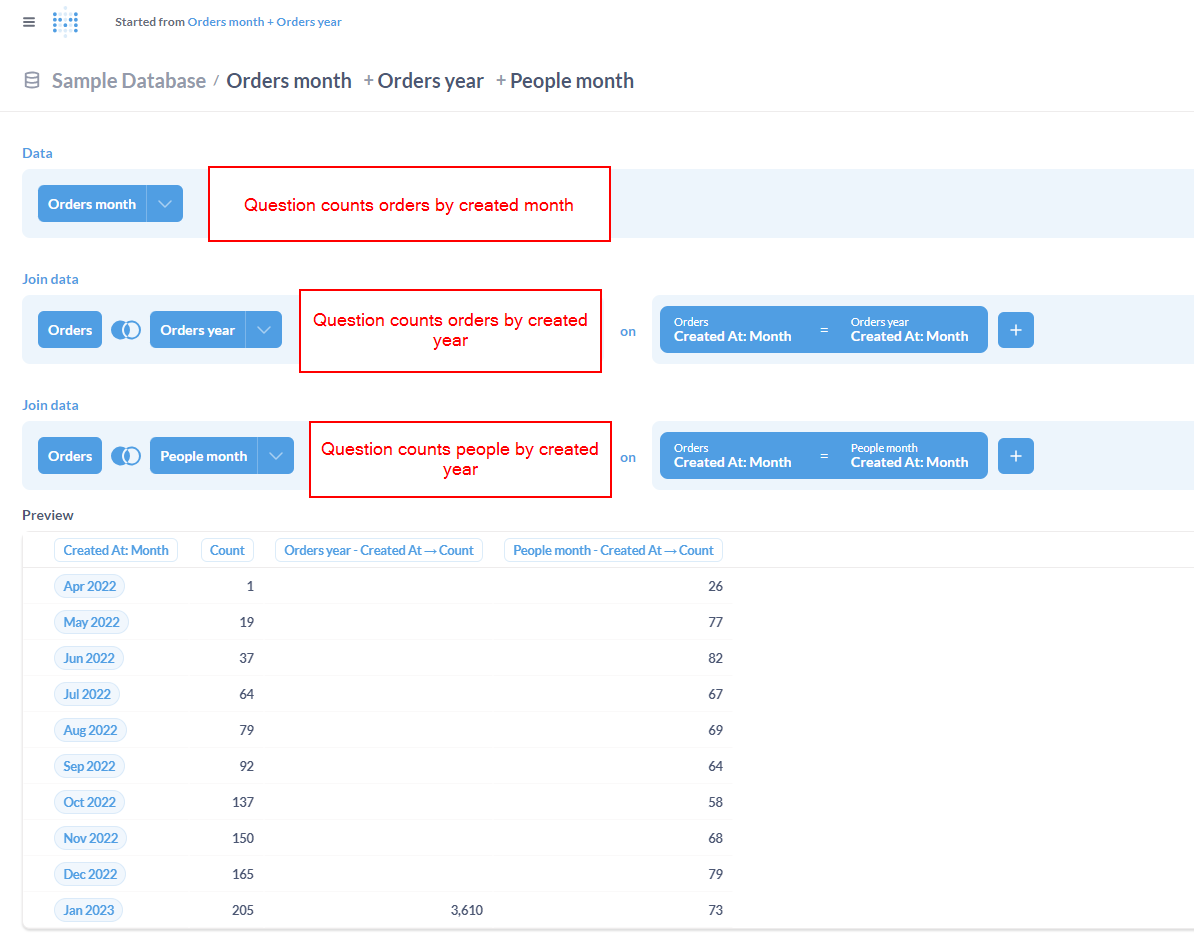
I just now tried going in the direction I caught somewhere in this forum: to build a new Question starting from the metric-producing sub-Questions, join them on the aggregated month, and show as a table. This approach works superficially but has a different problem: it does not allow to pass in the filters from the Dashboard, the widget says No valid fields.
I feel the absolutely best way product-wise would be for Metabase to allow in the Table the same "Edit series" as in the Line Chart. But I will take any other options gladly, too!
I had the same problem. We use Snowflake and they have PIVOT function which can change row to column. I use this and change my data in dbt or SQL in Metabase
Hello Azamat, I am not sure I follow: the Pivot operation is easily doable also on the Metabase side, and usually pivoting the data does not hurt the ability to filter it on a Dashboard.
What I need here is more like a "zip" operation between multiple Questions, retaining the ability to filter.
Also, in case this gets implemented any time soon Dynamic date grouping by day, week, month, quarter... on dashboards (and all questions) · Issue #6583 · metabase/metabase · GitHub I would also want the grouping granularity to be passable into the Questions being "zipped".
I am trying to avoid the need to use a SQL query in the first place. If I do this in SQL, the clients and our internal team using the Dashboard will not be able to use it as a starting point and adapt it to their needs.
Yes, I could build the database table/view supporting exactly the Dashboard I need to build, and I could probably get the filtering working somehow, but what's the point of using Metabase then?
Build a Metabase model based on a SQL query for all the base data you want to summarise. Models can be used pretty well as the base for further questions and summaries, there are limits but I find them useful. If that's too slow then you probably needed a reporting table in your DB anyway.
Thanks, that would be a good way to wrap the SQL to be more gentle to the users. In my eyes, this does not fix the some of the important problems though, so let me recap:
If you have a bunch of series showing data over time, and you want to have them as one combined Line Chart, you can achieve this fully in Metabase, never touching SQL, just by intuitively clicking around.
If you want to just have a different view of the same series, Table instead of a Line Chart, you need to eject everything you built, go to SQL, and rebuild the same thing on the side?
Can we agree that this is not ideal? In terms of:
Exploration (in the Line Chart one can click through and reach the original underlying data, in the Table as you suggest one reaches a Model),
Flexibility (suppose one wants to add a new series, compare what needs to happen on the Line Chart vs. Table side; think what this does to any notion of self-serviceability by our clients),
QA (how do you make sure both visualizations work the same way).
In case you have the same problem I just described and handle it as you described, can you please share some of your best practices to avoid the mentioned problems?
(If my message seems a bit desperate it's because my fingers are twitchy - transplanting the approach Metabase already has in Line Chart to Table must be reasonably simple...)
I'm just trying to offer a work around to something that Metabase doesn't do. What you're asking for is not something I've ever needed to do. I use models kind of like a lightweight view, fully managed in Metabase, you've already said tables/views was a way you could solve this problem, so I thought that suggestion might help.
Another option could be to join your series saved questions in the notebook editor by the date field, then view as a table. No SQL required. Want to add more series? Just do another join. Assumes some common date of course, but then I assume that's the case if you wanted them displayed side by side in a table anyway.
I wouldn't assume adding a series to a table is the same as adding it to a chart, the internal models could be quite different. Lines on a chart don't need to relate to each other, columns of a row in a table imply (to me anyway) a common date grain. Log your idea as a feature request in their Github you might get some traction.
Thanks for your messages, I hope I don't come across as ungrateful! I really appreciate your time helping me.
I think I tried exactly what you describe in the screenshot. That direction seems to work initially, but when you put it in a Dashboard and try to apply filtering, it ends up like my last screenshot: the criteria you'd want to filter on (outside of the month and the aggregated counts) are somehow not "getting through" this process of "wrapping up each series as a Question and then combining them by month". Perhaps I need to try again and make sure that the particular series carry the columns I want to filter on into this combination stage.
Good point about the Github! I'll first try to find some existing requests and write a new one if needed. Will also post it here for future reference.