After upgrading to Metabase 0.58.4, with the change to the manual y-axis range, many of our Combo charts that have different y-axis scales no longer work as expected. In particular, we often have a number as bars, and a corresponding percentage as a line.
Before, when we put the percentage axis on the right and set the manual y-axis to a range of 0→1, it would fix the percentage scale to 100% and then auto the left scale. This ensured a consistent visualisation for the percentage.
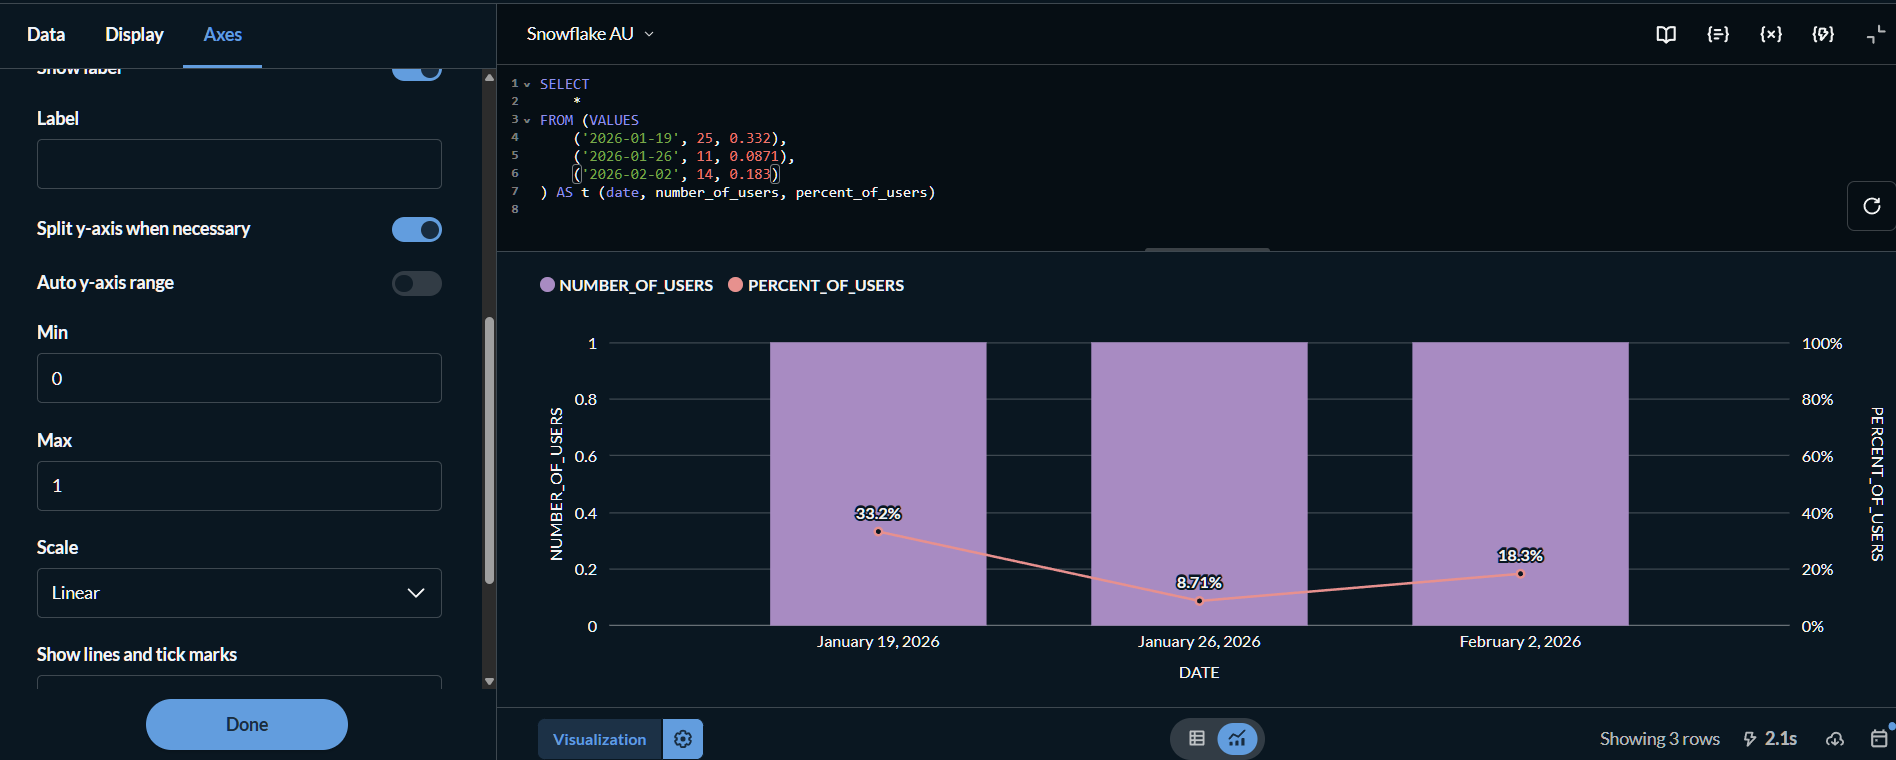
Now, both scales are fixed to the manual value (in this case, 1), which means the numerical bars are all capped at 1.
Example to Reproduce:
- Run this query:
SELECT
	*
FROM (VALUES
	('2026-01-19', 25, 0.332),
	('2026-01-26', 11, 0.0871),
	('2026-02-02', 14, 0.183)
) AS t (date, number_of_users, percent_of_users)
- Visualise as “Combo”
- Set
PERCENT_OF_USERS's “Y-axis position” to “Right”, and optionally set to “Percent” style. - Go to “Axes”, uncheck “Auto y-axis range” and set Min=0; Max=1
- The percent scale is out of 100%, as expected, but the bar values are visually capped at 1. Beforehand, the LHS bar chart scale would auto to roughly the highest value in the dataset (in this case 25).
It’s a little unclear whether this is a bug or a feature request - I guess by right we should be able to set the ranges for both y-axes when they are split, but this seems to be an unintended consequence of the restricted y-axis change.