Metabase will hang for between one and three minutes at random times. It occurs mostly when loading Metabase in a new browser / session, or between sections ( from Dashboard, going to Admin, for instance ). This is intermittent -- sometimes, it works just great.
We're running 0.32.8 through Docker on AWS ECS. It's connected to two PostgreSQL databases, one for its config and another for its data. The config DB is currently db.t3.medium, and the data DB is a db.m4.large. Route 53 (CNAME metabase.production) routes to an application load balancer on port :80. The application load balancer redirects to the ECS service on port :3000.
I'm not seeing anything interesting in the logs, unfortunately ( maybe that "request canceled before finishing" ? ). There's nothing logged that seems to say it's waiting on anything as I'm waiting... the browser just spins, waiting. Here are some example logs. In this example, I did nothing for a few minutes, and then at 17:55:30 or so, I hit Metabase in an anonymous browser. The page loaded around 17:57.
Jun 04 17:50:50 DEBUG metabase.middleware.log :: GET /api/user/current 200 3 ms (3 DB calls) Jetty threads: 4/50 (3 idle, 0 queued) (66 total active threads) Queries in flight: 0
Jun 04 17:50:50 DEBUG metabase.middleware.log :: GET /api/session/properties 200 3 ms (1 DB calls) Jetty threads: 4/50 (3 idle, 0 queued) (66 total active threads) Queries in flight: 0
Jun 04 17:50:50 DEBUG metabase.middleware.log :: GET /api/database 200 3 ms (3 DB calls) Jetty threads: 3/50 (4 idle, 0 queued) (66 total active threads) Queries in flight: 0
Jun 04 17:50:50 DEBUG metabase.middleware.log :: GET /api/setting 200 383 µs (0 DB calls) Jetty threads: 3/50 (4 idle, 0 queued) (66 total active threads) Queries in flight: 0
Jun 04 17:50:50 DEBUG metabase.middleware.log :: POST /api/dashboard/2/cards 200 38 ms (15 DB calls) Jetty threads: 4/50 (3 idle, 0 queued) (66 total active threads) Queries in flight: 0
Jun 04 17:50:50 DEBUG metabase.middleware.log :: POST /api/dashboard/2/cards 200 48 ms (15 DB calls) Jetty threads: 3/50 (4 idle, 0 queued) (66 total active threads) Queries in flight: 0
Jun 04 17:50:50 DEBUG metabase.middleware.log :: PUT /api/dashboard/2/cards 200 31 ms (26 DB calls) Jetty threads: 3/50 (4 idle, 0 queued) (66 total active threads) Queries in flight: 0
Jun 04 17:50:50 DEBUG metabase.middleware.log :: PUT /api/dashboard/2 200 6 ms (5 DB calls) Jetty threads: 3/50 (4 idle, 0 queued) (66 total active threads) Queries in flight: 0
Jun 04 17:50:50 DEBUG metabase.middleware.log :: GET /api/dashboard/2 200 17 ms (10 DB calls) Jetty threads: 4/50 (3 idle, 0 queued) (66 total active threads) Queries in flight: 0
Jun 04 17:52:49 DEBUG metabase.middleware.log :: GET /api/user/current 200 3 ms (3 DB calls) Jetty threads: 4/50 (3 idle, 0 queued) (64 total active threads) Queries in flight: 0
Jun 04 17:52:49 DEBUG metabase.middleware.log :: GET /api/session/properties 200 3 ms (1 DB calls) Jetty threads: 4/50 (3 idle, 0 queued) (64 total active threads) Queries in flight: 0
Jun 04 17:52:49 DEBUG metabase.middleware.log :: GET /api/database 200 3 ms (3 DB calls) Jetty threads: 4/50 (3 idle, 0 queued) (65 total active threads) Queries in flight: 0
Jun 04 17:52:49 DEBUG metabase.middleware.log :: GET /api/setting 200 486 µs (0 DB calls) Jetty threads: 4/50 (3 idle, 0 queued) (66 total active threads) Queries in flight: 0
Jun 04 17:57:19 DEBUG metabase.middleware.log :: GET /api/user/current 200 4 ms (3 DB calls) Jetty threads: 4/50 (3 idle, 0 queued) (64 total active threads) Queries in flight: 0
Jun 04 17:57:19 DEBUG metabase.middleware.log :: GET /api/session/properties 200 3 ms (1 DB calls) Jetty threads: 4/50 (3 idle, 0 queued) (64 total active threads) Queries in flight: 0
Jun 04 17:57:19 DEBUG metabase.middleware.log :: GET /api/database 200 3 ms (3 DB calls) Jetty threads: 3/50 (4 idle, 0 queued) (65 total active threads) Queries in flight: 0
Jun 04 17:57:19 DEBUG metabase.middleware.log :: GET /api/collection/root/items 200 6 ms (7 DB calls) Jetty threads: 3/50 (4 idle, 0 queued) (65 total active threads) Queries in flight: 0
Jun 04 17:57:19 DEBUG metabase.middleware.log :: GET /api/setting 200 518 µs (0 DB calls) Jetty threads: 3/50 (4 idle, 0 queued) (65 total active threads) Queries in flight: 0
Jun 04 17:57:19 DEBUG metabase.middleware.log :: GET /api/collection/root 200 2 ms (2 DB calls) Jetty threads: 3/50 (4 idle, 0 queued) (65 total active threads) Queries in flight: 0
Jun 04 17:57:40 INFO metabase.middleware.exceptions :: Request canceled before finishing.
Jun 04 17:57:42 DEBUG metabase.middleware.log :: GET /api/user/current 200 3 ms (3 DB calls) Jetty threads: 4/50 (5 idle, 0 queued) (70 total active threads) Queries in flight: 0
Jun 04 17:57:42 DEBUG metabase.middleware.log :: GET /api/session/properties 200 5 ms (1 DB calls) Jetty threads: 3/50 (6 idle, 0 queued) (70 total active threads) Queries in flight: 0
Jun 04 17:57:42 DEBUG metabase.middleware.log :: GET /api/database 200 3 ms (3 DB calls) Jetty threads: 3/50 (6 idle, 0 queued) (70 total active threads) Queries in flight: 0
Jun 04 17:57:42 DEBUG metabase.middleware.log :: GET /api/setting 200 473 µs (0 DB calls) Jetty threads: 3/50 (6 idle, 0 queued) (70 total active threads) Queries in flight: 0
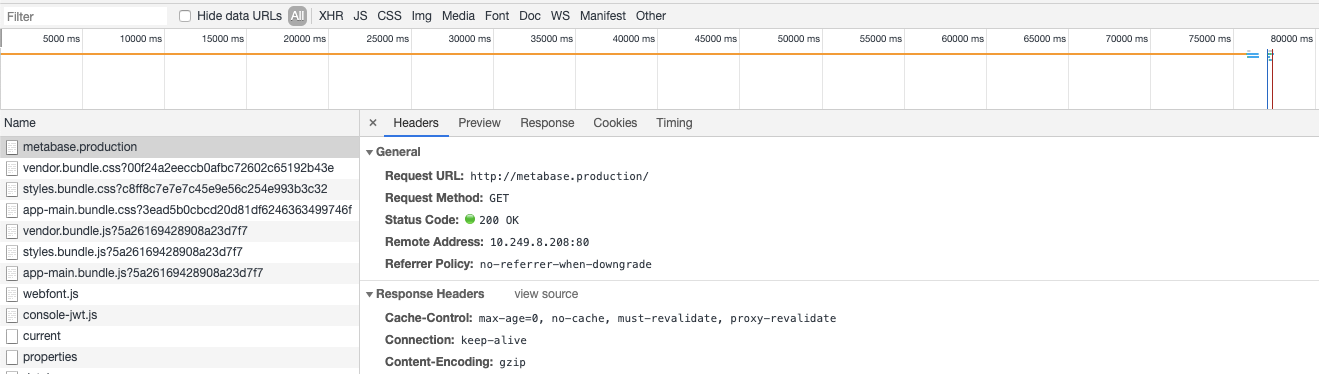
Here's an example 1.3 minute load from an anonymous browser.

Those 401s on current, I assume, are because I'm not logged in. They do not occur when I'm logged in.
Many thanks for any help or insight !