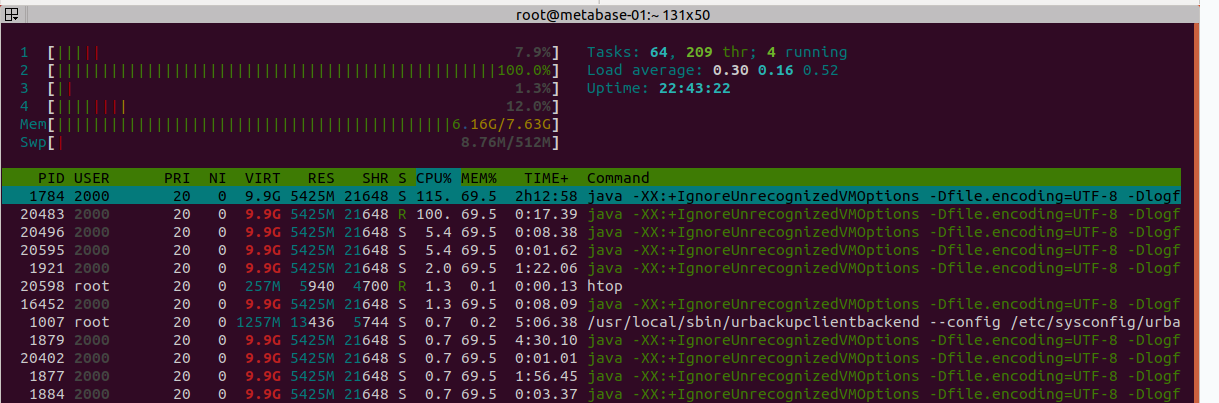
After the SELECT from Postgres DB, the Metabase internal processing runs on ONE CPU core only. This makes queries quite slow. Is there some build flag or something that I’m missing, that would allow it to run on several cores and split the load accordingly? This is even implemented in Metabase’s core functionality?
Hi @tomand
Please post “Diagnostic Info” from Admin > Troubleshooting.
Metabase is highly multi-threaded application that uses all available CPUs. It must be a configuration in your environment if it only uses a single core.
I understand that some or major functionality of metabase is multi-threaded. Although, seems connections from external DB > Metabase is somehow inefficient. The results which comes from db are being aggregated just with one CPU core on Metabase. I can make some htop/pg_top screenshots. But it’s unhelpfull because we can’t see anything what’s going on under-hood.
Thank you for your time. That's exactly what I expected. Our data is very specific. Probably I can't write step by step how to reproduce it. But the main idea is that:
Pushing SQL Query from Metabase (as an example from Metabase troubleshoot logs):
{:native
"WITH latestPrices AS (\n SELECT *\n FROM public.view_latest_price_in_7_days ),\n\nprices24hAgo AS (\n SELECT *\n FROM public.view_prices_24h_ago_in_7_days ),\n\nlatestBalances AS (\n SELECT \n b.\"coin_id\",\n SUM(b.\"balance\") as balance,\n SUM(b.\"balance_24hago\") as balance24hago,\n MAX(b.\"date\") as date\n FROM mstable.\"Balance_latest\" as b\n WHERE b.balance > 0 AND date_trunc('day', b.\"date\") = date_trunc('day', NOW())\n AND b.coin_id != '0xa3bed4e1c75d00fa6f4e5e6922db7261b5e9acd2' AND b.\"address_id\" IN (\n '0xf617346a0fb6320e9e578e0c9b2a4588283d9d39', '0xd55684f4369040c12262949ff78299f2bc9db735', '0x881c72d1e6317f10a1cdcbe05040e7564e790c80', '0xf7575d4d4db78f6ba43c734616c51e9fd4baa7fb', '0x25970282aac735cd4c76f30bfb0bf2bc8dad4e70', '0xf4a7d2d85f4ba11b5c73c35e27044c0c49f7f027', '0x9b4aba35b35eee7481775ccb4055ce4e176c9a6f', '0x0d4cd2c24a4c9cd31fcf0d3c4682d234d9f94be4') GROUP BY b.\"coin_id\"\n),\n\nbalancesInUsd AS (\n SELECT\n SUM(b.balance/10^c.decimals * p.usd_price) AS \"balance_usd\",\n SUM(b.balance24hago /10^c.decimals * p24.usd_price) AS \"balance_usd_24h_ago\"\n FROM latestBalances AS b\n LEFT JOIN public.coins c ON c.id = b.coin_id\n FULL JOIN latestPrices p ON p.coin_id = b.coin_id\n FULL JOIN prices24hAgo p24 ON p24.coin_id = b.coin_id\n),\n\nbalances AS (\n SELECT \n CAST(b.balance_usd as numeric) as \"latestTvl\",\n CAST(b.balance_usd_24h_ago as numeric) as \"tvl24hAgo\",\n ((b.balance_usd - b.balance_usd_24h_ago) / b.balance_usd_24h_ago) as \"tvl24hDiff\"\n FROM balancesInUsd b\n)\n\nSELECT * FROM balances"}
PostgreSQL acquiring the data then sends back the results to the Metabase engine.
Metabase engine parses the data up to 5 minutes because of 1 CPU core involved.
Metabase outputs JSON in order to visualize parsed data as a Graph.
I can understand your bottleneck example, but what is your proposed solution? Remember that if Metabase allowed a single user’s query to consume all CPU resources, then it would effectively block anyone else from using Metabase until it was done - we don’t want that.
But how much data are you returning? Since I think there might be a problem with “reducing” (parsing the results), which somehow makes it take way too long than what it’s supposed to.
And that is definitely something we want to address, but it would be great if you could provide a sample schema and query, so it can be reproduced.
If we have ways to reproduce issues, then it’s much easier for developers and we can write tests to ensure this doesn’t happen.
Is there a way how check query execution processes on metabase? eg:
how much time was spent on execute query
how much time take to fetch data
how much time it takes to reduce result and give response to user
does any cache was participated?
Its ok that metabase is using 1 CPU requesting datasource , but it is not ok if only 1 CPU is used to process received big data chunks in my opinion.
Is somewhere instructions available how to clarify what metabase is doing when receive request to execute query and how much time was spent in each step?
As i understand user can block instance using to much CPU, to much RAM, to much Storage, to much NETWORK. It should be something like Resource pool limit per user or per query.
Currently it is not possible to speed up instance with more resources because it is logical limitations programmed. Am i right?
 on the first post