Metabase > x10 times slower than the SQL query?

G'day,

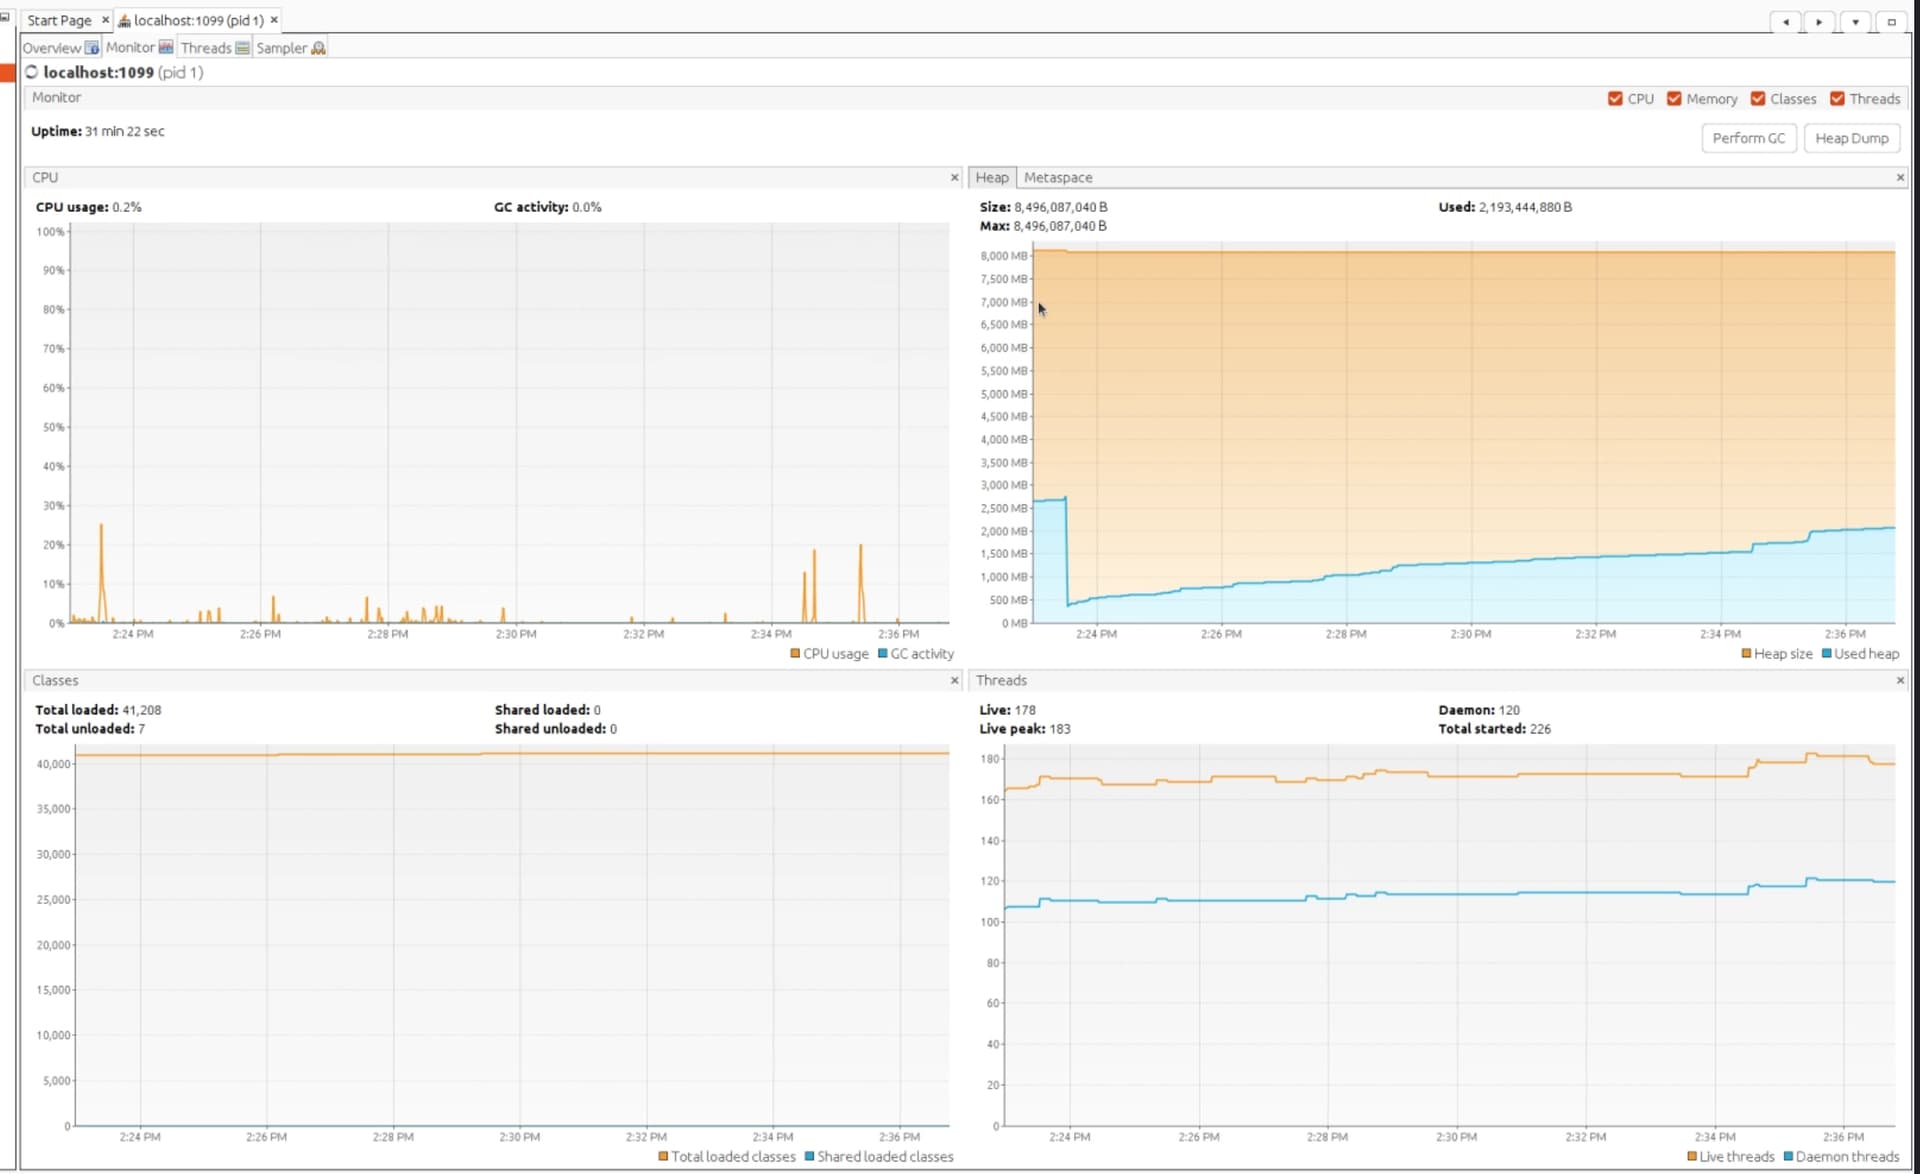
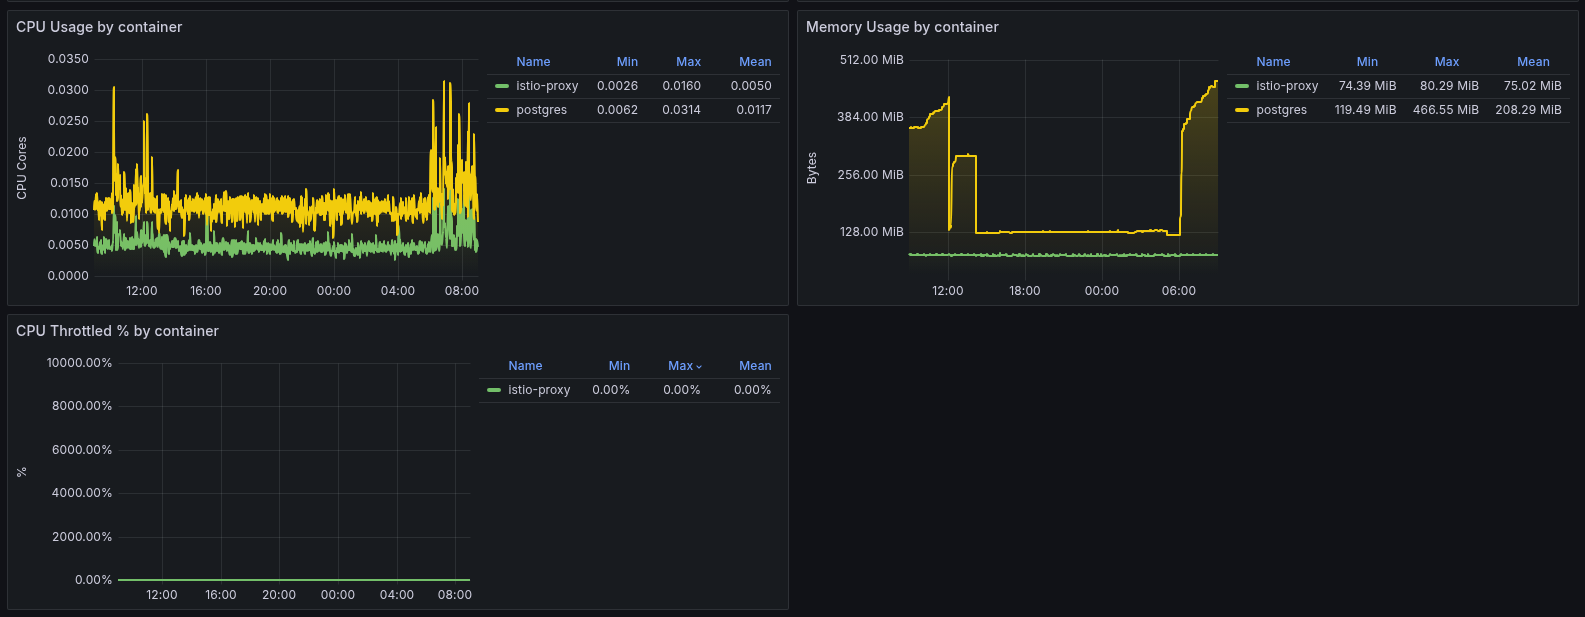
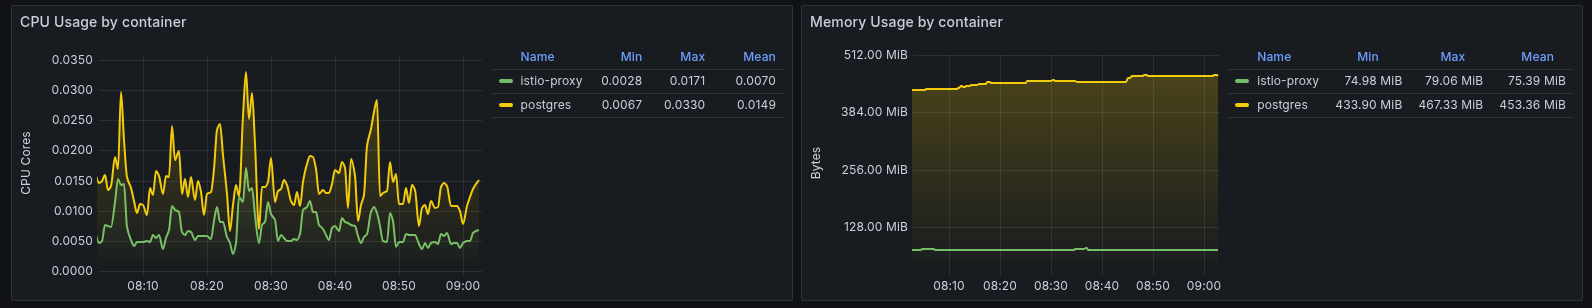
We've been trying to performance tune Metabase, so that the dashboards load quickly.

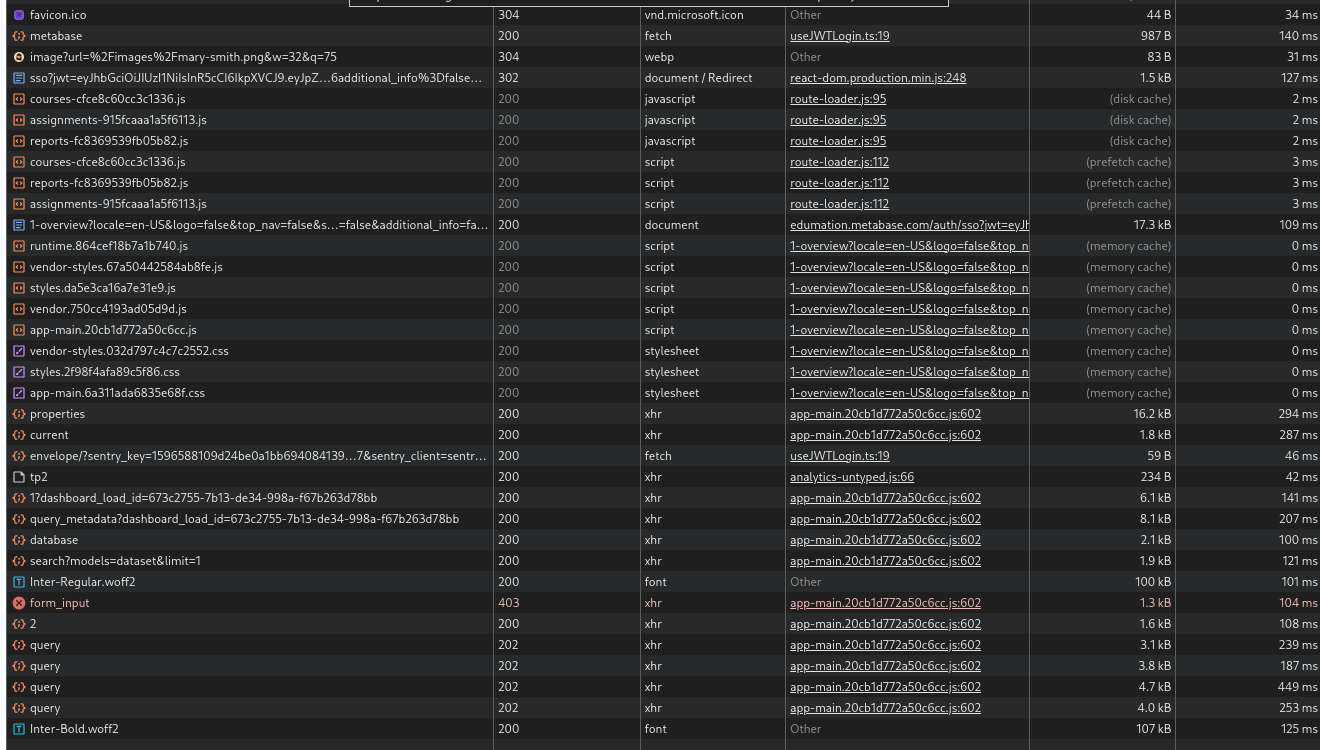
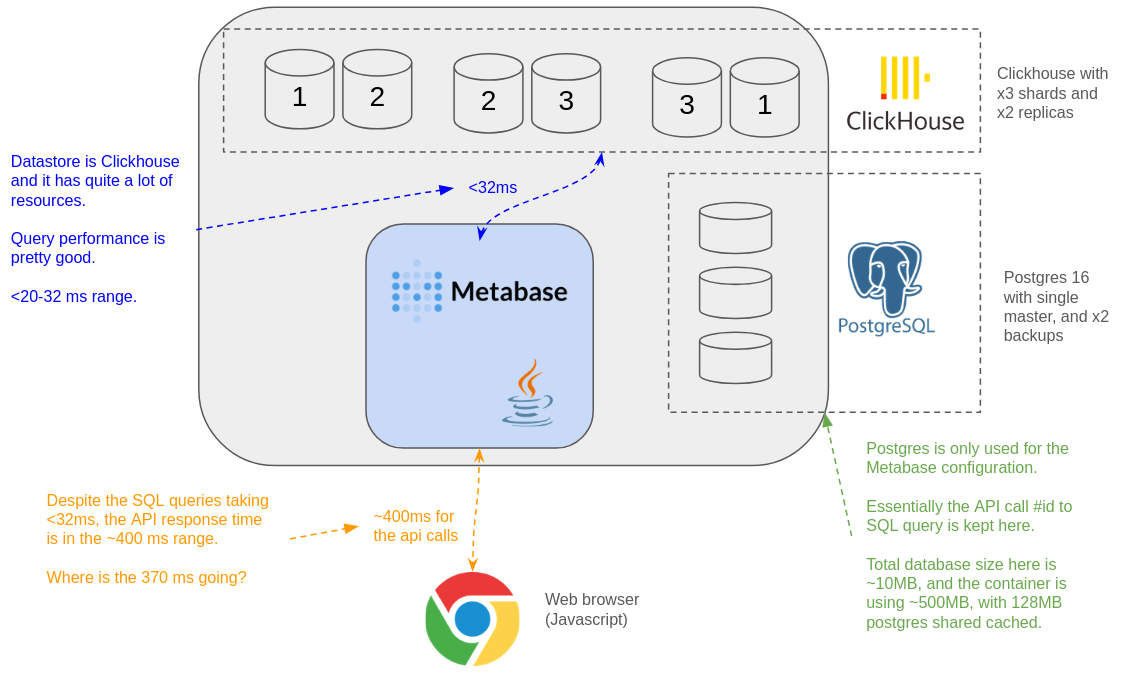
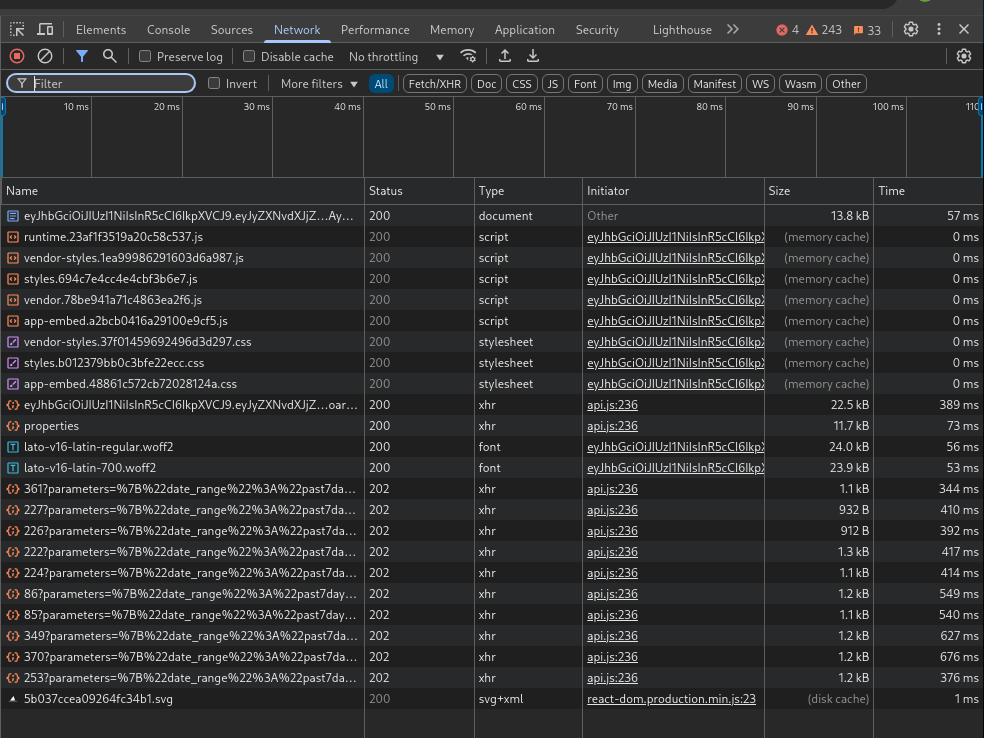
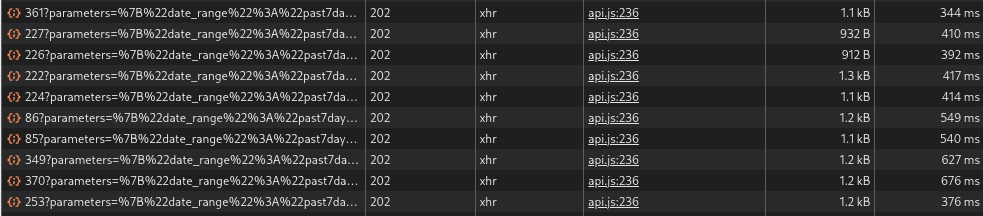
However, we have found that the Metabase API calls seem to be very slow, with a very large overhead per call. Metabase API response time seems to be approximately x10 the SQL query time.

We have created a dashboard with x3 Metabase graphs, and we have been comparing the API response time to the SQL response time.2. 3.

Daily = 369.8 ms API response, SQL response in 21ms ( 369.8/21 ~= 17.6 )
Hourly = 388.4 ms API response, SQL response in 30ms ( 388.4/30 ~= 12.94 )
Raw = 432.9 ms API response, SQL response in 32ms ( 432.9/32~= 13.52 )

The API response time for these calls is 369.8 ms, 388.4 ms, 432.9 ms

2025-03-10 19:23:31,243 DEBUG middleware.log :: POST /api/dashboard/45/dashcard/418/card/368/query 202 [ASYNC: completed] 369.8 ms (16 DB calls) App DB connections: 1/46 Jetty threads: 7/200 (19 idle, 0 queued) (160 total active threads) Queries in flight: 2 (0 queued); clickhouse DB 2 connections: 0/9 (0 threads blocked) {:metabase-user-id 2}
2025-03-10 19:23:31,260 WARN sql-jdbc.execute :: Statement cancelation failed.
2025-03-10 19:23:31,261 DEBUG middleware.log :: POST /api/dashboard/45/dashcard/419/card/367/query 202 [ASYNC: completed] 388.4 ms (15 DB calls) App DB connections: 1/46 Jetty threads: 7/200 (19 idle, 0 queued) (160 total active threads) Queries in flight: 1 (0 queued); clickhouse DB 2 connections: 0/9 (0 threads blocked) {:metabase-user-id 2}
2025-03-10 19:23:31,295 WARN sql-jdbc.execute :: Statement cancelation failed.
2025-03-10 19:23:31,296 DEBUG middleware.log :: POST /api/dashboard/45/dashcard/420/card/369/query 202 [ASYNC: completed] 432.9 ms (16 DB calls) App DB connections: 1/46 Jetty threads: 7/200 (19 idle, 0 queued) (160 total active threads) Queries in flight: 0 (0 queued); clickhouse DB 2 connections: 2/9 (0 threads blocked) {:metabase-user-id 2}

Each of these is making a query to a different Clickhouse table, which is materialized views, which are doing hour, daily, aggregations for us.

46 rows in set. Elapsed: 0.032 sec. (32 ms)

SELECT
    toStartOfHour(source.delivery_start_time) AS delivery_start_time,
    AVG(source.applied_bitrate) AS avg
FROM
(
    SELECT
        siden_dist.cloud_unicast_delivery.sen_id AS sen_id,
        siden_dist.cloud_unicast_delivery.sp_id AS sp_id,
        siden_dist.cloud_unicast_delivery.sector_carrier AS sector_carrier,
        siden_dist.cloud_unicast_delivery.sector AS sector,
        siden_dist.cloud_unicast_delivery.service_area AS service_area,
        siden_dist.cloud_unicast_delivery.max_slte AS max_slte,
        siden_dist.cloud_unicast_delivery.set_bitrate AS set_bitrate,
        siden_dist.cloud_unicast_delivery.applied_bitrate AS applied_bitrate,
        siden_dist.cloud_unicast_delivery.ratio AS ratio,
        siden_dist.cloud_unicast_delivery.delivery_start_time AS delivery_start_time,
        siden_dist.cloud_unicast_delivery.delivery_end_time AS delivery_end_time,
        siden_dist.cloud_unicast_delivery.downloading_type AS downloading_type,
        siden_dist.cloud_unicast_delivery.delivery_id AS delivery_id,
        siden_dist.cloud_unicast_delivery.count_of_files AS count_of_files,
        siden_dist.cloud_unicast_delivery.bytes_delivered AS bytes_delivered,
        siden_dist.cloud_unicast_delivery.connection_count AS connection_count,
        siden_dist.cloud_unicast_delivery.connection_duration AS connection_duration,
        siden_dist.cloud_unicast_delivery.total_duration AS total_duration,
        siden_dist.cloud_unicast_delivery.result AS result,
        siden_dist.cloud_unicast_delivery.siden_tx_kbps AS siden_tx_kbps,
        siden_dist.cloud_unicast_delivery.siden_rx_kbps AS siden_rx_kbps,
        siden_dist.cloud_unicast_delivery.total_tx_kbps AS total_tx_kbps,
        siden_dist.cloud_unicast_delivery.total_rx_kbps AS total_rx_kbps,
        siden_dist.cloud_unicast_delivery.reported_at AS reported_at,
        siden_dist.cloud_unicast_delivery.siden_tx_kbps_avg AS siden_tx_kbps_avg,
        siden_dist.cloud_unicast_delivery.total_tx_kbps_avg AS total_tx_kbps_avg,
        siden_dist.cloud_unicast_delivery.siden_tx_kbps_peak AS siden_tx_kbps_peak,
        siden_dist.cloud_unicast_delivery.total_tx_kbps_peak AS total_tx_kbps_peak
    FROM siden_dist.cloud_unicast_delivery
) AS source
WHERE ((NOT (positionUTF8(source.sen_id, 'vsen') > 0)) OR (source.sen_id IS NULL)) AND ((NOT (positionUTF8(source.sen_id, 'simsen') > 0)) OR (source.sen_id IS NULL))
GROUP BY toStartOfHour(source.delivery_start_time)
ORDER BY toStartOfHour(source.delivery_start_time) ASC

Query id: 4a114877-8e80-47a5-ab3e-237e97a3ecac

    ┌─delivery_start_time─┬────────────────avg─┐
 1. │ 2024-12-10 18:00:00 │             167288 │
 2. │ 2024-12-10 19:00:00 │              47296 │
 3. │ 2024-12-11 04:00:00 │             119840 │
 4. │ 2024-12-11 05:00:00 │             127160 │
 5. │ 2024-12-18 21:00:00 │ 21517.473684210527 │
 6. │ 2024-12-18 22:00:00 │  8008.888888888889 │
 7. │ 2024-12-20 14:00:00 │              17840 │
 8. │ 2024-12-20 15:00:00 │ 15950.666666666666 │
 9. │ 2024-12-20 16:00:00 │                  0 │
10. │ 2024-12-23 21:00:00 │ 19256.727272727272 │
11. │ 2025-01-08 15:00:00 │  84513.77777777778 │
12. │ 2025-01-08 16:00:00 │                  0 │
13. │ 2025-01-08 17:00:00 │                  0 │
14. │ 2025-01-09 02:00:00 │              80400 │
15. │ 2025-01-09 22:00:00 │              32264 │
16. │ 2025-01-09 23:00:00 │              14144 │
17. │ 2025-01-10 00:00:00 │                  0 │
18. │ 2025-01-16 15:00:00 │  36567.11111111111 │
19. │ 2025-01-16 16:00:00 │              21760 │
20. │ 2025-01-16 17:00:00 │                  0 │
21. │ 2025-01-23 23:00:00 │              21968 │
22. │ 2025-02-06 03:00:00 │             143016 │
23. │ 2025-02-06 04:00:00 │                  0 │
24. │ 2025-02-07 20:00:00 │ 123562.66666666667 │
25. │ 2025-02-14 16:00:00 │ 60930.666666666664 │
26. │ 2025-02-14 17:00:00 │              41712 │
27. │ 2025-02-25 14:00:00 │             160688 │
28. │ 2025-02-25 15:00:00 │ 142501.33333333334 │
29. │ 2025-02-25 16:00:00 │ 175045.33333333334 │
30. │ 2025-02-25 17:00:00 │            46409.6 │
31. │ 2025-02-27 03:00:00 │  70744.88888888889 │
32. │ 2025-02-27 04:00:00 │ 60490.666666666664 │
33. │ 2025-02-27 21:00:00 │  357514.6666666667 │
34. │ 2025-02-27 22:00:00 │             272496 │
35. │ 2025-02-27 23:00:00 │ 105245.09090909091 │
36. │ 2025-02-28 00:00:00 │ 232587.63636363635 │
37. │ 2025-02-28 01:00:00 │                  0 │
38. │ 2025-02-28 02:00:00 │                  0 │
39. │ 2025-02-28 03:00:00 │  71525.33333333333 │
40. │ 2025-02-28 04:00:00 │             363776 │
41. │ 2025-02-28 05:00:00 │ 241898.66666666666 │
42. │ 2025-02-28 06:00:00 │             360448 │
43. │ 2025-02-28 07:00:00 │             362032 │
44. │ 2025-02-28 08:00:00 │             179392 │
45. │ 2025-03-04 15:00:00 │ 131066.66666666667 │
46. │ 2025-03-04 16:00:00 │ 18506.666666666668 │
    └─────────────────────┴────────────────────┘

46 rows in set. Elapsed: 0.032 sec. 

45 rows in set. Elapsed: 0.030 sec. (30 ms)

SELECT
    toStartOfHour(source.delivery_start_time) AS delivery_start_time,
    AVG(source.avg_applied_bitrate) AS avg
FROM
(
    SELECT
        siden_dist.cloud_unicast_delivery_counts_h1.delivery_start_time AS delivery_start_time,
        siden_dist.cloud_unicast_delivery_counts_h1.sen_id AS sen_id,
        siden_dist.cloud_unicast_delivery_counts_h1.sp_id AS sp_id,
        siden_dist.cloud_unicast_delivery_counts_h1.sector AS sector,
        siden_dist.cloud_unicast_delivery_counts_h1.downloading_type AS downloading_type,
        siden_dist.cloud_unicast_delivery_counts_h1.result AS result,
        siden_dist.cloud_unicast_delivery_counts_h1.avg_set_bitrate AS avg_set_bitrate,
        siden_dist.cloud_unicast_delivery_counts_h1.avg_applied_bitrate AS avg_applied_bitrate,
        siden_dist.cloud_unicast_delivery_counts_h1.sum_count_of_files AS sum_count_of_files,
        siden_dist.cloud_unicast_delivery_counts_h1.sum_bytes_delivered AS sum_bytes_delivered,
        siden_dist.cloud_unicast_delivery_counts_h1.sum_connection_count AS sum_connection_count,
        siden_dist.cloud_unicast_delivery_counts_h1.sum_connection_duration AS sum_connection_duration,
        siden_dist.cloud_unicast_delivery_counts_h1.sum_total_duration AS sum_total_duration,
        siden_dist.cloud_unicast_delivery_counts_h1.count AS count
    FROM siden_dist.cloud_unicast_delivery_counts_h1
) AS source
WHERE ((NOT (positionUTF8(source.sen_id, 'vsen') > 0)) OR (source.sen_id IS NULL)) AND ((NOT (positionUTF8(source.sen_id, 'simsen') > 0)) OR (source.sen_id IS NULL))
GROUP BY toStartOfHour(source.delivery_start_time)
ORDER BY toStartOfHour(source.delivery_start_time) ASC

Query id: 049d1ec6-98e0-45e7-98da-0b269754ecae

    ┌─delivery_start_time─┬─────avg─┐
 1. │ 2024-12-10 19:00:00 │  212832 │
 2. │ 2024-12-11 04:00:00 │  239680 │
 3. │ 2024-12-11 05:00:00 │  254320 │
 4. │ 2024-12-18 21:00:00 │  408832 │
 5. │ 2024-12-18 22:00:00 │   72080 │
 6. │ 2024-12-20 14:00:00 │   17840 │
 7. │ 2024-12-20 15:00:00 │  191408 │
 8. │ 2024-12-20 16:00:00 │       0 │
 9. │ 2024-12-23 21:00:00 │  211824 │
10. │ 2025-01-08 15:00:00 │  760624 │
11. │ 2025-01-08 16:00:00 │       0 │
12. │ 2025-01-08 17:00:00 │       0 │
13. │ 2025-01-09 02:00:00 │   80400 │
14. │ 2025-01-09 22:00:00 │   64528 │
15. │ 2025-01-09 23:00:00 │  169728 │
16. │ 2025-01-10 00:00:00 │       0 │
17. │ 2025-01-16 15:00:00 │  329104 │
18. │ 2025-01-16 16:00:00 │  261120 │
19. │ 2025-01-16 17:00:00 │       0 │
20. │ 2025-01-23 23:00:00 │   43936 │
21. │ 2025-02-06 03:00:00 │  286032 │
22. │ 2025-02-06 04:00:00 │       0 │
23. │ 2025-02-07 20:00:00 │  741376 │
24. │ 2025-02-14 16:00:00 │  365584 │
25. │ 2025-02-14 17:00:00 │  291984 │
26. │ 2025-02-25 14:00:00 │  160688 │
27. │ 2025-02-25 15:00:00 │  427504 │
28. │ 2025-02-25 16:00:00 │  525136 │
29. │ 2025-02-25 17:00:00 │  232048 │
30. │ 2025-02-27 03:00:00 │  636704 │
31. │ 2025-02-27 04:00:00 │  362944 │
32. │ 2025-02-27 21:00:00 │ 2145088 │
33. │ 2025-02-27 22:00:00 │ 3269952 │
34. │ 2025-02-27 23:00:00 │ 1157696 │
35. │ 2025-02-28 00:00:00 │ 2558464 │
36. │ 2025-02-28 01:00:00 │       0 │
37. │ 2025-02-28 02:00:00 │       0 │
38. │ 2025-02-28 03:00:00 │  858304 │
39. │ 2025-02-28 04:00:00 │ 4365312 │
40. │ 2025-02-28 05:00:00 │ 2902784 │
41. │ 2025-02-28 06:00:00 │ 4325376 │
42. │ 2025-02-28 07:00:00 │ 4344384 │
43. │ 2025-02-28 08:00:00 │  358784 │
44. │ 2025-03-04 15:00:00 │  393200 │
45. │ 2025-03-04 16:00:00 │  111040 │
    └─────────────────────┴─────────┘

45 rows in set. Elapsed: 0.030 sec. 

16 rows in set. Elapsed: 0.021 sec. (21ms)

SELECT
    toStartOfHour(source.delivery_start_time) AS delivery_start_time,
    AVG(source.avg_applied_bitrate) AS avg
FROM
(
    SELECT
        siden_dist.cloud_unicast_delivery_counts_d1.delivery_start_time AS delivery_start_time,
        siden_dist.cloud_unicast_delivery_counts_d1.sen_id AS sen_id,
        siden_dist.cloud_unicast_delivery_counts_d1.sp_id AS sp_id,
        siden_dist.cloud_unicast_delivery_counts_d1.sector AS sector,
        siden_dist.cloud_unicast_delivery_counts_d1.downloading_type AS downloading_type,
        siden_dist.cloud_unicast_delivery_counts_d1.result AS result,
        siden_dist.cloud_unicast_delivery_counts_d1.avg_set_bitrate AS avg_set_bitrate,
        siden_dist.cloud_unicast_delivery_counts_d1.avg_applied_bitrate AS avg_applied_bitrate,
        siden_dist.cloud_unicast_delivery_counts_d1.sum_count_of_files AS sum_count_of_files,
        siden_dist.cloud_unicast_delivery_counts_d1.sum_bytes_delivered AS sum_bytes_delivered,
        siden_dist.cloud_unicast_delivery_counts_d1.sum_connection_count AS sum_connection_count,
        siden_dist.cloud_unicast_delivery_counts_d1.sum_connection_duration AS sum_connection_duration,
        siden_dist.cloud_unicast_delivery_counts_d1.sum_total_duration AS sum_total_duration,
        siden_dist.cloud_unicast_delivery_counts_d1.count AS count
    FROM siden_dist.cloud_unicast_delivery_counts_d1
) AS source
WHERE ((NOT (positionUTF8(source.sen_id, 'vsen') > 0)) OR (source.sen_id IS NULL)) AND ((NOT (positionUTF8(source.sen_id, 'simsen') > 0)) OR (source.sen_id IS NULL))
GROUP BY toStartOfHour(source.delivery_start_time)
ORDER BY toStartOfHour(source.delivery_start_time) ASC

Query id: 62053f4c-f84a-46d1-8b32-ba73f42a2c94

    ┌─delivery_start_time─┬──────avg─┐
 1. │ 2024-12-11 00:00:00 │   494000 │
 2. │ 2024-12-18 00:00:00 │   480912 │
 3. │ 2024-12-20 00:00:00 │   209248 │
 4. │ 2024-12-23 00:00:00 │   211824 │
 5. │ 2025-01-08 00:00:00 │   760624 │
 6. │ 2025-01-09 00:00:00 │   157328 │
 7. │ 2025-01-10 00:00:00 │        0 │
 8. │ 2025-01-16 00:00:00 │   590224 │
 9. │ 2025-01-23 00:00:00 │    43936 │
10. │ 2025-02-06 00:00:00 │   286032 │
11. │ 2025-02-07 00:00:00 │   741376 │
12. │ 2025-02-14 00:00:00 │   657568 │
13. │ 2025-02-25 00:00:00 │  1345376 │
14. │ 2025-02-27 00:00:00 │  3786192 │
15. │ 2025-02-28 00:00:00 │ 19713408 │
16. │ 2025-03-04 00:00:00 │   504240 │
    └─────────────────────┴──────────┘

16 rows in set. Elapsed: 0.021 sec. 

The question is, is this expected? Are we missing some tuning?

Maybe I don't understand what Metabase is doing, but I imagine the steps are:

  1. API query comes in from the browser
  2. Metabase maps the API call to the SQL query
  3. SQL query is performed
  4. Returned rows are turned into JSON, and passed back to the client
  5. Within the browser the JSON is passed to the Javascript to render the JSON into the graph

If we look at one of our examples, this means that if the total API call is 369.8 ms, and the SQL query time is 21ms, then Metabase is taking 369.8-21=348.8 ms to perform steps 2 + 4. Step 2, should be just a hash lookup, so API query number to SQL query. That should be fast. Step 4 is basically converting 16 rows returned by Clickhouse into json. How long can it take to turn 16 rows into json? Can't be long.

So why is it so slow?

Thanks in advance,
Dave

These are a couple of screenshots.

We have the metabase dashboard with the x3 queries, shows the developer tools latency breakdown.

We also show the JMX debugger, and the CPU is no longer getting limited.

We have given a lot of resources to Metabase, now up to 12 CPU cores.

resources:
  requests:
    memory: 10Gi
    cpu: 4
  limits:
    memory: 10Gi
    cpu: 12


What’s the app db and what’s its size?

Thanks Luigi.

We are using Postgres, which is running in the very same k8s cluster, so we expect the performance to be good.

The pg_dump size is ~10 MB.

ThinkPad-T14s-Gen-3:~/workspace/metabase-configs/migration$ ls -ltr metabase.sql 
-rw-rw-r-- 1 vivek vivek 10391605 Mar  4 14:41 metabase.sql

We see the CPU consumption is low, and it has plenty of RAM.

[das@t:~/Downloads]$ kubectl --kubeconfig=dev-d.kubeconfig top pod metabase-pg-1 -n data
NAME            CPU(cores)   MEMORY(bytes)
metabase-pg-1   43m          509Mi

We are using default configuration, except we did over ride the max connections, to allow up to 200. ( Not that we need too, because we see that Metabase is only using 1 or 2 connections under the current load. )

postgres@metabase-pg-1:/$ cat /var/lib/postgresql/data/pgdata/postgresql.conf | egrep "max_connections|shared_buffers|effective_cache_size|maintenance_work_mem|checkpoint_completion_target|wal_buffers|default_statistics_target|random_page_cost|effective_io_concurrency|work_mem|huge_pages|min_wal_size|max_wal_size"
max_connections = 100			# (change requires restart)
shared_buffers = 128MB			# min 128kB
#huge_pages = try			# on, off, or try
#work_mem = 4MB				# min 64kB
#hash_mem_multiplier = 2.0		# 1-1000.0 multiplier on hash table work_mem
#maintenance_work_mem = 64MB		# min 1MB
#autovacuum_work_mem = -1		# min 1MB, or -1 to use maintenance_work_mem
#logical_decoding_work_mem = 64MB	# min 64kB
#effective_io_concurrency = 1		# 1-1000; 0 disables prefetching
#wal_buffers = -1			# min 32kB, -1 sets based on shared_buffers
#checkpoint_completion_target = 0.9	# checkpoint target duration, 0.0 - 1.0
max_wal_size = 1GB
min_wal_size = 80MB
#random_page_cost = 4.0			# same scale as above
#effective_cache_size = 4GB
#default_statistics_target = 100	# range 1-10000
postgres@metabase-pg-1:/$ 

Given a total DB size of 10MB, and the container using ~500MB, and shared buffers at 128MB, it seems like there should be absolutely no performance problem with Postgres.

I guess I'm interested to know if other Metabase users see similar API latency, or if we might have something going wrong. Do you know the typical rough API latency for a simple chart like the ones we are doing? If, for example, our latency is waaay outside of expectations, then we can debug this some more.

Thanks in advance,
Dave

Postgres container performance. = It's not busy. Not throttled.

Higher resolution. Last hour. = Not busy.

Network bandwidth show the traffic is very low.

Just looking at your demo page, it seems like this high latency is normal. We are seeing roughly the same latency as this.

Check it out:

What's the database backend for this demo site? I wonder how quickly those SQL queries are returning.

Network latency is pretty good.

[das@t:~]$ ping embedding-demo.metabase.com
PING cname.vercel-dns.com (76.76.21.241): 56 data bytes
64 bytes from 76.76.21.241: icmp_seq=0 ttl=12 time=21.418 ms
64 bytes from 76.76.21.241: icmp_seq=1 ttl=13 time=17.711 ms
^C--- cname.vercel-dns.com ping statistics ---
2 packets transmitted, 2 packets received, 0% packet loss
round-trip min/avg/max/stddev = 17.711/19.564/21.418/1.854 ms

[das@t:~]$ host embedding-demo.metabase.com
embedding-demo.metabase.com is an alias for cname.vercel-dns.com.
cname.vercel-dns.com has address 66.33.60.35
cname.vercel-dns.com has address 76.76.21.241

[das@t:~]$ host cname.vercel-dns.com
cname.vercel-dns.com has address 76.76.21.241
cname.vercel-dns.com has address 66.33.60.35

[das@t:~]$ whois vercel-dns.com
   Domain Name: VERCEL-DNS.COM
   Registry Domain ID: 2514230885_DOMAIN_COM-VRSN
   Registrar WHOIS Server: whois.tucows.com
   Registrar URL: http://www.tucows.com

I don't know if this is the same issue. We were having terrible performance problems with Postgres and Metabase.
Solution was to add preferQueryMode=simple to the connection in Metabase.

Thanks @AndrewMBaines

Interesting. This option seems to be if the data store is Postgres, if I understand correctly.

We are using Clickhouse for our main data store, and Postgres for the configuration database. Clickhouse is dramatically faster than Postgres because it does LSM and the query gets fanned out across the replicas.

The diagram looks roughly like this:

If you are ok to share, I'd be very interested to see a screenshot of the "Developer tools", "Network" tab when you load a dashboard. This would show us how long the API calls are taking.

e.g. You can see the "query" calls here

Specifically, I mean these "query"/ "api.js" calls.

We spun up Java Mission Control to see what on earth is going on inside Metabase
( JDK Mission Control )

To do this we just ran up Metabase locally with the StartFlightRecording configure:

docker run -d -p 3000:3000 --net=host -v /home/vivek/Mini_Desktop/binaries/metabase/temp/plugins:/plugins -e "MB_PLUGINS_DIR=/plugins" -e JAVA_OPTS="-Xms1G -Xmx1G -XX:+UnlockDiagnosticVMOptions -XX:+DebugNonSafepoints -XX:StartFlightRecording=duration=180s,filename=/tmp/recording.jfr -XX:+UseCompressedOops -XX:+UseParallelGC -Duser.timezone=UTC -Dcom.sun.management.jmxremote.port=1099 -Dcom.sun.management.jmxremote.rmi.port=1099 -Dcom.sun.management.jmxremote.authenticate=false -Dcom.sun.management.jmxremote.ssl=false -Dcom.sun.management.jmxremote.local.only=false -Djava.rmi.server.hostname=127.0.0.1"   -e "MB_DB_TYPE=postgres"   -e "MB_DB_DBNAME=ChangeMe"   -e "MB_DB_PORT=5432"   -e "MB_DB_USER=ChangeMe"   -e "MB_DB_PASS=ChangeMe"   -e "MB_DB_HOST=192.168.122.1"  --name metabase metabase/metabase:v0.50.19.4

( Please note that in this configuration we had some configuration pointing at an old data source that doesn't exist, so it threw some execptions on startup. That's ok, we know these errors are expected. )

We were focused on trying to understand why the DB takes ~32ms, while Metabase then takes >400ms

Turns out Clojure using all the CPU time ( clojure.lang.Util.hasheq(Object) )
( Clojure - Wikipedia , Lisp (programming language) - Wikipedia )

We can see that query middleware is hardly using any time at all

We can also see the Garbage Collections are not a problem at all

Zooming in on FrameGraph of this clojure.lang.Util.hasheq(Object), we can see a LOT of salmon color, which is bad.

Specifically, at LOT of CPU time is spent in the Utils clojure.

I guess this means that ultimately the slowness is deep within Metabase's implementation decision to use Clojure.

Interesting, give us a few days to unravel this mistery

@daveseddon I see a few things in the testing that you made:

  1. why are you using v0.50.19.4 ??? can you try with the latest version? there have been A LOT of updates since then, it's a version almost a year old
  2. please remove -XX:+UseCompressedOops -XX:+UseParallelGC from the JVM options
  3. use at least 2GB of RAM in -Xms1G -Xmx1G

can you try again changing all these?

Thanks. Just to keep this thread up-to-date

We've upgraded to v0.53.7 and 1.53.3 Clickhouse driver, which includes the upgrade to Java 21.

We've using the default GC options, and removed the GC logging. The container is allowed up to 10G RAM.

JAVA_OPTS: -Xms8G -Xmx8G -XX:+UseCompressedOops -Dcom.sun.management.jmxremote.port=1099 -Dcom.sun.management.jmxremote.rmi.port=1099 -Dcom.sun.management.jmxremote.authenticate=false -Dcom.sun.management.jmxremote.ssl=false -Dcom.sun.management.jmxremote.local.only=false -Djava.rmi.server.hostname=127.0.0.1

Just comparing the performance quickly with the Chrome DevTools, the performance looks essentially the same.

I guess the other curious thing about the slowness, is that Metabase is even slow when there's essentially zero data. e.g. SQL query to clickhouse is returning zero rows, yet we still see Metabase API calls taking hundreds of milliseconds.

Another example

We will run Mission Control again on this as it's running, and will report back.

ok and is there any way you can compare against a postgres database with a "select 1"? I mean, I have a feeling that this is deep down the clickhouse driver

Thanks again

It's interesting you think this could be clickhouse related.

Your demo site embedding-demo.metabase.com is similarly slow, although perhaps not as bad.

What's the database behind that? Is it clickhouse?

Ok, so the reason Metabase is so slow is that it uses reflection

Reflection is slow!! Like, they say it's "slow" and you think, "how slow can it be?". Turns out it is REALLY slow.

I recently rewrote some go code that was using reflection, and the rewrite without refection was x50 times faster!! 50!! This isn't just an order of magnitude, it's an order of magnitude times x5 = Don't use refection

Here's an example from my go code of reflection verse not reflection.... Assuming metabase stopped using reflection, I would expect a similar x50ish performance improvement.

|BenchmarkDeserializeTCPInfo-16                       |68040174   |17.39 ns/op     |<-----  non-reflection|
|---|---|---|---|
|BenchmarkDeserializeTCPInfoReflection-16             |1270778  |942.7 ns/op    |   <--------- Reflection !!|

If you search the internets, literally the first thing they say is don't use reflection:

To determine this, we ran it locally again, with the new versions of Metabase + clickhouse driver. We gave it the 2GB rams as requested, although we are actually running with 8GBs in our real environments.

Main PID: 443502 (java)
      Tasks: 52 (limit: 36914)
     Memory: 1.1G
        CPU: 43.979s
     CGroup: /system.slice/metabase.service
             └─443502 /home/vivek/Mini_Desktop/binaries/java/jdk-23.0.2/bin/java --add-opens java.base/java.nio=ALL-UNNAMED -Xms2G -Xmx2G -XX:+UnlockDiagnosticVMOptions -XX:+DebugNonSafepoints -XX:StartFlightRecording=duration=180s,filename=/home/vivek/Mini_Desktop/binaries/metaba>

Once again we see our good friend clojure hasheq(Object o) using all the time

If we look at the code it is obvious why this is slow:

  1. It is using "instanceof". "instanceof" means reflection #DontDoThis
  2. It's recursively using "instanceof"
public static int hasheq(Object o){
	if(o == null)
		return 0;
	if(o instanceof IHashEq)
		return dohasheq((IHashEq) o);	
	if(o instanceof Number)
		return Numbers.hasheq((Number)o);
	if(o instanceof String)
		return Murmur3.hashInt(o.hashCode());
	return o.hashCode();
}

private static int dohasheq(IHashEq o) {
	return o.hasheq();
}

... I thought about how to handle this reflection challenge in go also. Assuming you are handling the same types again and again ( you obviously are ), then you could detect that you're going to do the same thing, and cache it.

For good measure, you can see the java stuffs here

We can see the GC and so on is fine

This is the link to the flight recording, if you want to look, but you can get this from any instance of Metabase

that's a postgres, but the edumation demo is super special since there's sandboxing there and many middlewares happening checking for several permissions to avoid data leakages

@Luiggi

g'day mate - i hope you are doing well.

Does the new release address any of the performance concerns related to the reflection please?

"

Performance upgrades to the SQL and custom expression editors

We’ve updated some behind-the-scenes parts of the SQL and custom expression editor, bringing better performance, fixing autocomplete bugs, and laying the groundwork for future enhancements, like custom syntax highlighting.
"

Would love to know more details please

Hi, we've checked the reflection claims and we have instrumentation set in the build code that catches every possible reflection and removes that (it's there since the beginning of the times), so there's no reflection happening here

Thanks @luiggi

Happy to jump on a call with our Java expert ( who is in US Central timezone ) to show you the Mission Control analysis, if the screenshots we have posted aren't enough. ( In Java reflection is called "instanceof" )

Oh yeah, and I did post the .jfr file, so you can see the recording. Did you try to open it with the Mission Control tool?