I have two series that I want to graph: (1) cumulative sales and (2) cumulative target by day. While the mouse over for (2) is correct, the mouse over for (1) shows the correct sales # and the INCORRECT target (the next day’s instead of the current one). The data in table form is correct. Is there a solution for graphing this with the correct mouse over? Thanks!
I also have this problem when use line and area chart, but bar chart is fine. please see the attach image. tks.!
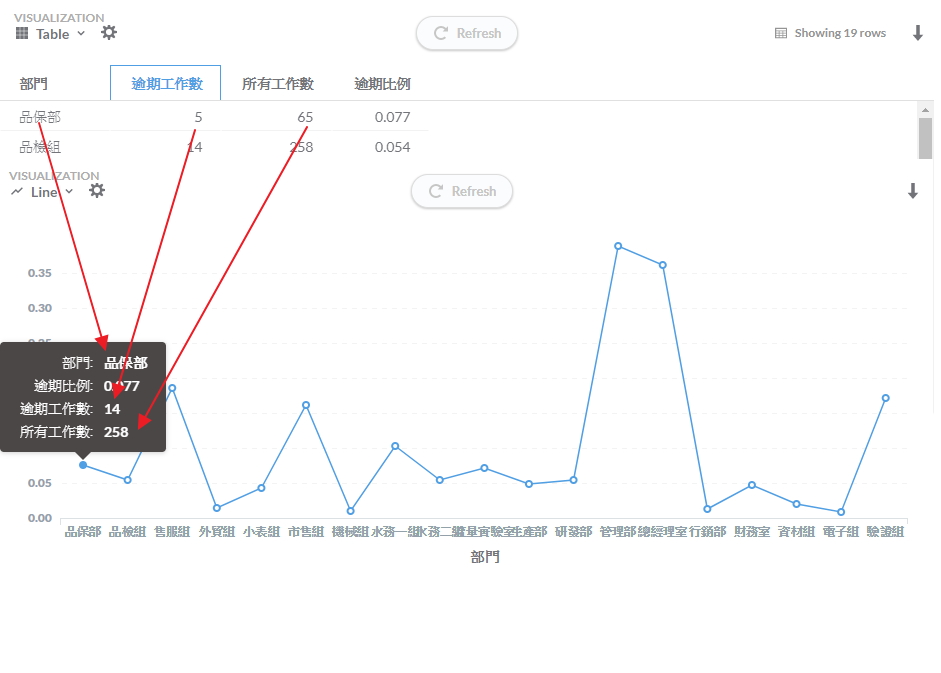
Looks like below issue which should already be fixed for upcoming v0.28
Would be useful if you guys are able to verify the fix - e.g. on a copy of you data either by building from source or alternatively using the https://hub.docker.com/r/metabase/metabase-head/ Docker image.
2 Likes
Thanks! I’ll verify the fix once the release is out.