Describe my bug:
As my topic noted, for a line plot(with more than one series), when i changed the settings of Replace missing values with to None, the whole series will disappear from the chart.
How to reproduce the bug
first, wriet as sql like below using the sample database:
select
  cast(created_at as DATE) as date,
  cast(RATING as CHARACTER) as rate_type,
  SUM(RATING)
from REVIEWS
group by date, rate_type
second, display the data with line plot type
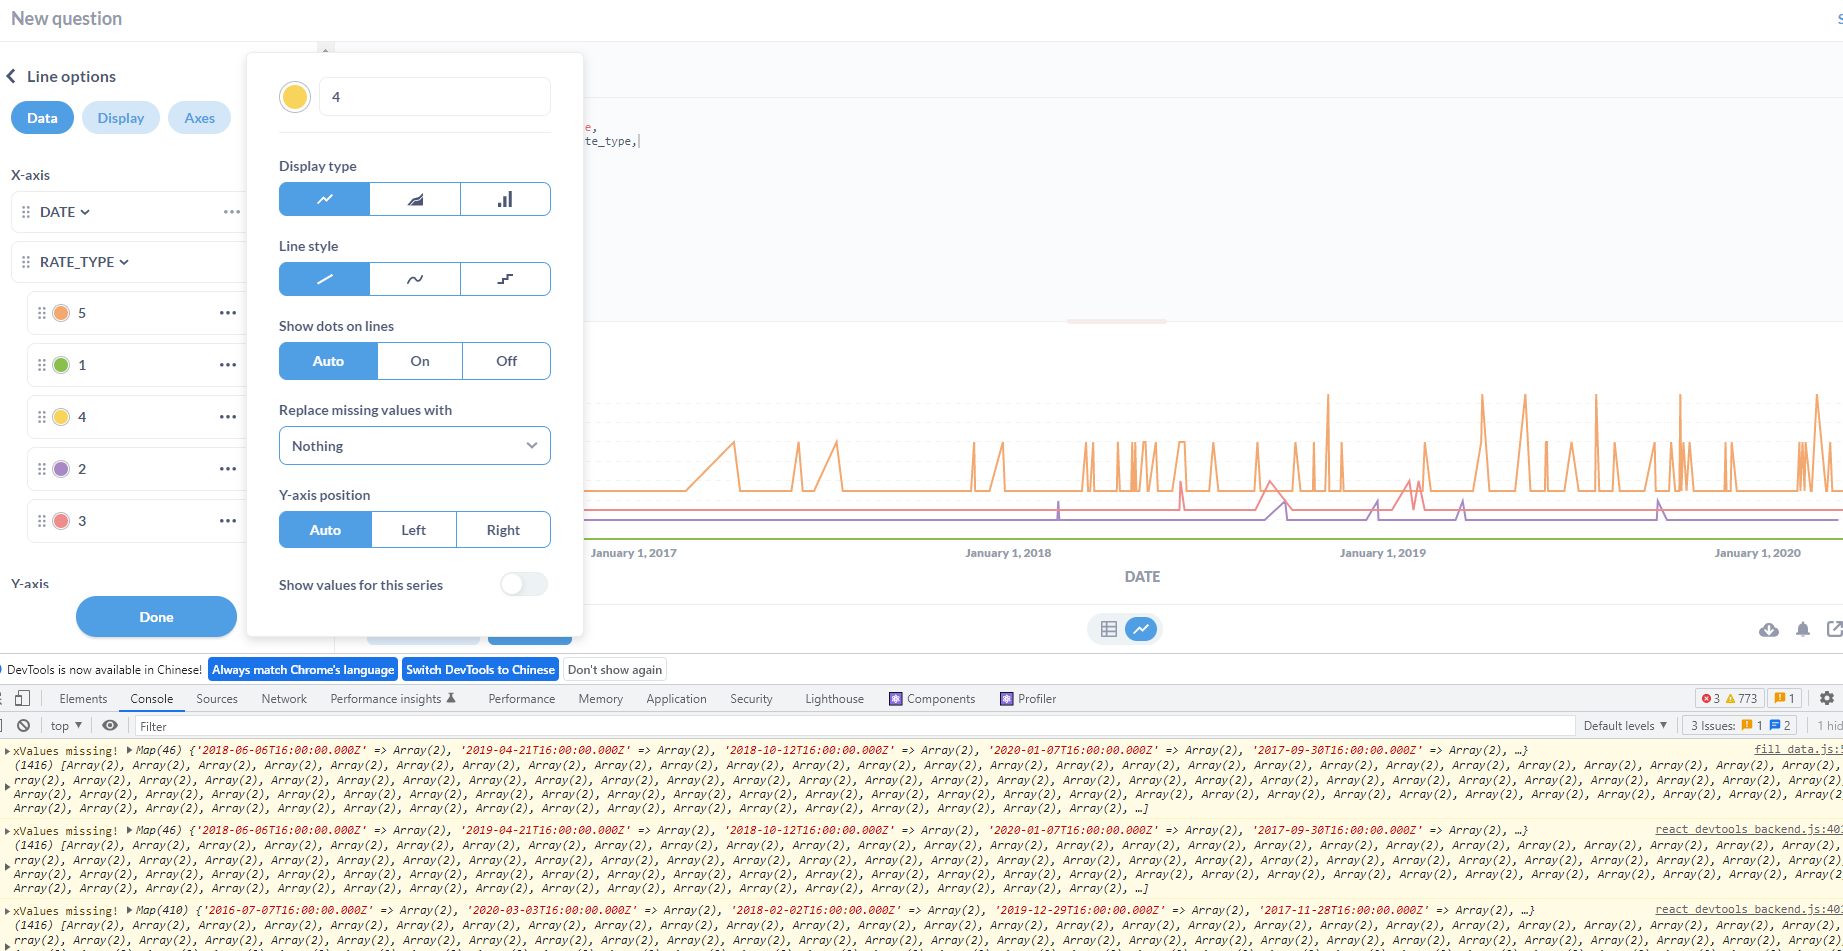
lastly, set the Replace missing values with for one of the rate_type(as the above uploaded image show ), then the series you choosed will be gone ![]()
PS
The version I used here is 0.45.1, the previous verson(before 0.45.0) seems good