Need a way to display empty results

Hello,

I'm having an issue trying to display results for a query that is actually not returning anything.
The problem is I have 3 queries on the same graph in a dashboard, and the one returning empty is the 1st one so Metabase cant handle that properly and is not showing the results from the other 2 either.

empty_graph

The above images show how it looks after a specific filter is applied to recreate the mentioned conditions. (Wanted to upload a picture from before too but since I'm a new user I couldn't)
As you can see the graph only shows 2 queries but there is really 3 of them, the other one is the original one and the one that shows no result.

Is there any way I can modify my query to actually return a value if nothing is returned or a way I can handle this so my dashboard displays the values properly ?

Hi @aleglez
That’s a known issue, where it shows the legend without the title, when the card is empty:

Hi @flamber, thanks for the reply.

I think is not exactly the same, I don't really care much about the legend, my real issue is that Im not seeing values that should be displayed.
The picture below shows the same graph before applying the filter, and all 3 queries are showing data. After the filter is applied, the 1st one (2019) does not return any value, but the other 2 does so I should still be able to see date for 2018 and 2017, but since the 1st query is empty it wont display anything.

full_graph

@aleglez
Which version are you using?
When using the filter, if you change the visualization to Table, do you see data for the other columns?
I’m guessing it’s some setting in the Bar visualization, so try clicking the Reset to defaults and see if that fixes it, then continue to customize it until it fails, then post the steps-to-reproduce here.

@flamber

Im using Metabase 0.32.4.
I cant change the visualization, that is a dashboard and the graph is showing 3 different queries together.
I know the other 2 should show some data because I went to each individual query and applied the same filter and noticed that only the 1st returns empty, the other 2 show real data.
This is not hard to reproduce, just get 2 compatible queries (use bars graphic since thats the one Im using and Im not sure if its going to happen with the other ones) and add them to the same graph in a dashboard. Make sure the 1st one you add returns nothing and the second one returns something, then you should get this issue.
My queries work good without the filter applied because there is data to show on the 1st one too, that’s the key here, the 1st one you add is the one that fails.

I cannot reproduce this issue with Sample Dataset.

Is there anything I can do to help ?

Yes, steps-to-reproduce using Sample Dataset - with an empty Dashboard, so no accidental conflicts with real/existing cards.

@flamber

ok, so I tried to reproduce this without using filters, just adding a couple compatible questions to a dashboard and making sure the 1st one didnt return any value but it works if you do that.
That made me think this issue only happens if there is a relative filter being used.

Imagine you have a stores table and a products_sold table, you have a FK on products_sold to store and you have entries for multiple products sold in multiple stores.

Data Sample:

table stores
id name
1 Store 1
2 Store 2

table products_sold
id name store_id sold_at
1 table 1 2019-04-18
2 chair 2 2019-04-17
3 desk 2 2019-04-18

And you have 2 queries, both showing Count(products_sold.id), sold_at, one for yesterday and one for today. You add both to a dashboard, on the same graphic, but you start with the yesterday one since you want to show dates in the right order.

You add a relative filter to both queries and the dashboard to filter by stores.name.

If no filter is applied, the graph will show ok since you have data for both queries so you will see 2 bars (remember I tried this with bar graphs) one for yesterday (Count = 1) and one for today (Count = 2).

If you apply the filter ‘Store 2’ then it will still work but it will show yesterday (Count = 1) and today (Count = 1) this time.

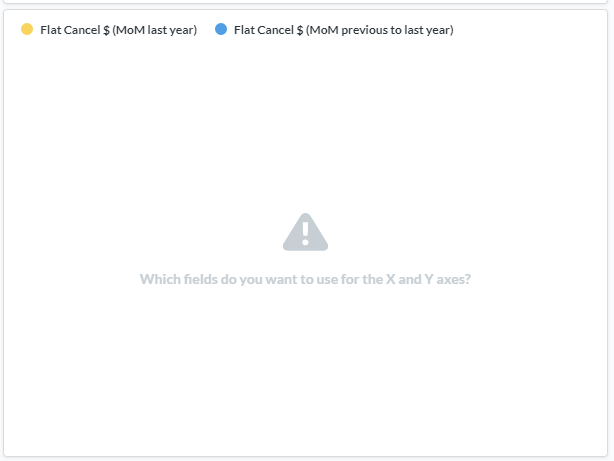
Now, if you apply the filter ‘Store 1’ you will get this issue because the 1st query you added (yesterday) has nothing to show for Store 1, so it comes back empty, and even if the 2nd query has a value to show it wont show up and your graph will end up looking like the 1st pic I posted.

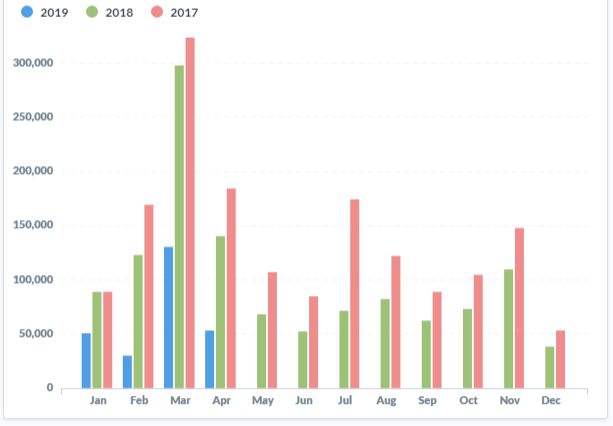
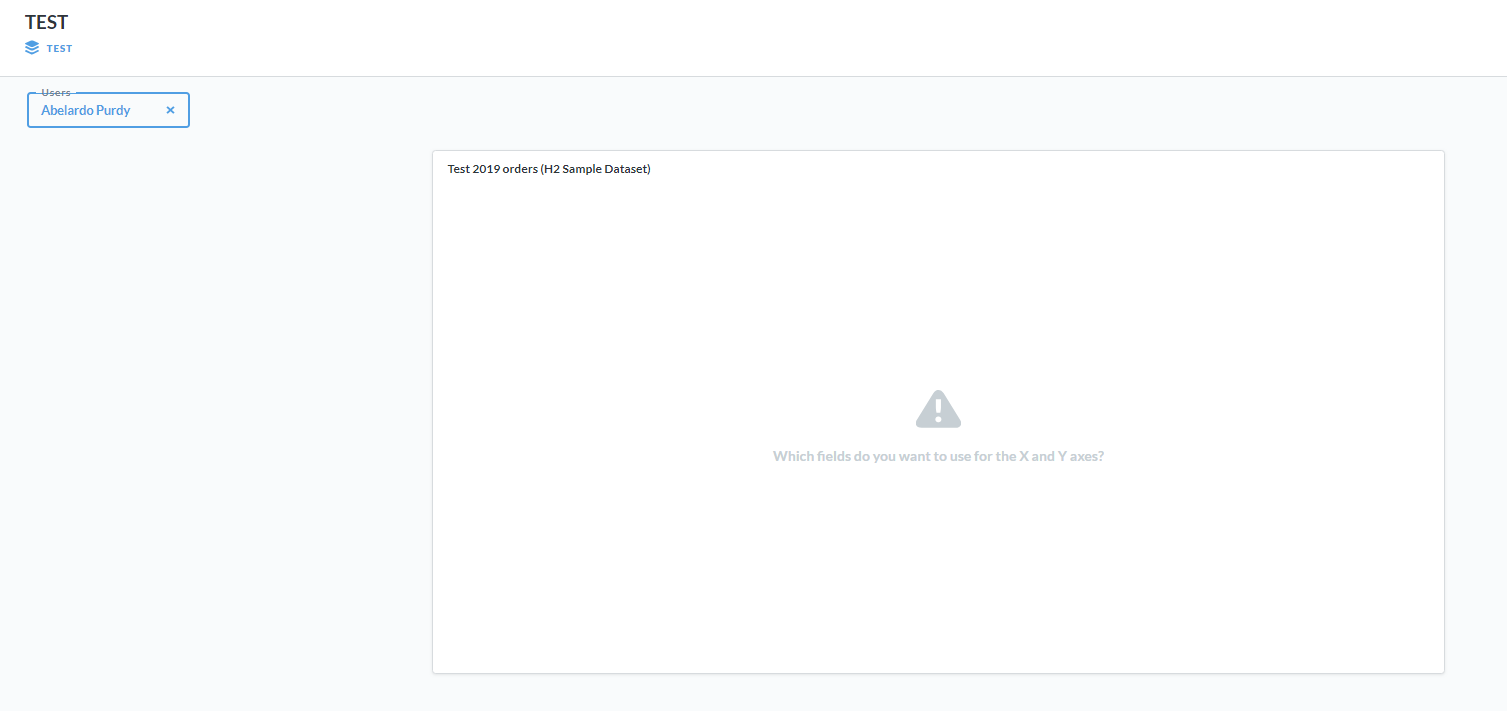
That’s pretty much it, if you look at the second pic I posted you can see everything displaying right, but I applied a filter where there is no results for 2019 but there is for 2018 and 2017, and yet it ended like that. It makes me wonder if this is because it will keep the display settings for the bar graph from the 1st query you added on the graph. so if that one is empty it wont know how to display the other ones since it wont get the config from those.

Also notice that 2019 query is not showing on the 1st pick on the header, only 2018 and 2017 are (they show the question real name).

Hopefully this gives you a better idea if the issue I’m having.

@aleglez
I've been trying to reproduce this with Sample Dataset without success - that's the default database, which makes it easier for others to reproduce, since we all have that.
41
You probably need to look at the query being made for each request and figure out where it's doing something wrong.
Check the browser console's Network-tab, click the POST-request for more details, then the Response-tab, and look for the native_query - then compare the different requests.

@flamber

This is the query Im using, is the same one in all 3 cases just changing the year to display 2019, 2018 and 2017.

SELECT SUM(payments.amount) as “Flat Cancel Amount”, to_char(protection_cancellations.created_at, ‘Mon’) as “Date”
FROM protection_cancellations JOIN payments ON protection_cancellations.id = payments.protection_cancellation_id JOIN loans ON payments.loan_id = loans.id JOIN dealers ON dealers.id = loans.dealer_id
WHERE cancellation_type = 1 AND date_trunc(‘year’, protection_cancellations.created_at) >= date_trunc(‘year’, current_date)
[[AND {{Agency}}]] [[AND {{Dealer}}]] [[AND {{Independent}}]]
GROUP BY to_char(protection_cancellations.created_at, ‘Mon’), extract(year from protection_cancellations.created_at), extract(month from protection_cancellations.created_at)
ORDER BY extract(year from protection_cancellations.created_at), extract(month from protection_cancellations.created_at)

I don’t have your database structure, so I cannot reproduce whatever you’re seeing.
If you can reproduce it with the database called Sample Dataset, then great, please post that.

If you have removed the database Sample Dataset, then you can create it again under Settings > Admin > Databases > there’s a little link under the list of databases.

1 Like

@flamber

Im trying to reproduce this and make queries for the Sample Dataset as similar to the ones I’m using as possible, however I cant use date_part and date_trunc doesn’t work properly.
I guess that’s not PostgreSQL and I cant use the same functions, not sure if it will work doing it in a different way but I will work on it

The Sample Dataset is a H2 database. Yes, it’s different, but the entire point is to make the most simple query - and then make it more advanced until it fails.

Hi @flamber,

Im working on the H2 Sample dataset, I have a couple queries that I think I could use to reproduce this issue, but somehow the relative filter is not working. Is there any difference for Metabase since this is H2 and not PostgreSQL

As I wrote earlier, Metabase doesn’t support aliases when using Field Filters, since the SQL has some alias, but the Field Filter connection is full schema.table.column

@flamber

I was able to reproduce it using your Sample Database:

Create the next 2 queries:

  • Test 2018 orders (H2 Sample Dataset)
SELECT SUM(ORDERS.QUANTITY) as Amount, to_char(ORDERS.CREATED_AT, 'Mon') as Mon
FROM ORDERS JOIN PEOPLE ON ORDERS.USER_ID = PEOPLE.ID
WHERE YEAR(ORDERS.CREATED_AT) = YEAR(current_date - 365) [[AND {{User}}]]
GROUP BY to_char(ORDERS.CREATED_AT, 'Mon'), extract(year from ORDERS.CREATED_AT), extract(month from ORDERS.CREATED_AT)
ORDER BY extract(year from ORDERS.CREATED_AT), extract(month from ORDERS.CREATED_AT)
  • Test 2019 orders (H2 Sample Dataset)
SELECT SUM(ORDERS.QUANTITY) as Amount, to_char(ORDERS.CREATED_AT, 'Mon') as Mon
FROM ORDERS JOIN PEOPLE ON ORDERS.USER_ID = PEOPLE.ID
WHERE YEAR(ORDERS.CREATED_AT) = YEAR(current_date) [[AND {{User}}]]
GROUP BY to_char(ORDERS.CREATED_AT, 'Mon'), extract(year from ORDERS.CREATED_AT), extract(month from ORDERS.CREATED_AT)
ORDER BY extract(year from ORDERS.CREATED_AT), extract(month from ORDERS.CREATED_AT)

Use bar graph on both and add them to a dashboard graph (2018 first), also using bars, it will look like this:

Then add a filter for the users on the dashboard and use "Abelardo Purdy". The thing is that user has orders for 2019 but not for 2018, so the expected behavior should be to only display results for 2019, but this is what happens:

This is exactly the same problem I'm having.

That’s great. I can reproduce this issue by following what you’re written (adjusted the quotes).
Just make sure to use ``` before and after a code blocks to preserve all formatting and quoting within the block.

This is a single quote ' and double quote "

Besides the issue I linked to in the first comment, I cannot think of a similar issue, so you should create a new issue with the new steps-to-reproduce:
https://github.com/metabase/metabase/issues/new

1 Like

@flamber

I didn’t know you can use markdown here, nice
I will open a new issue then. Thanks for your time and help