I have a combo line chart on top of a bar chart but the top numbers don't display when very close to the integrated line chart data points. I think the issue will resolve if the numbers displayed below the data points/circles.
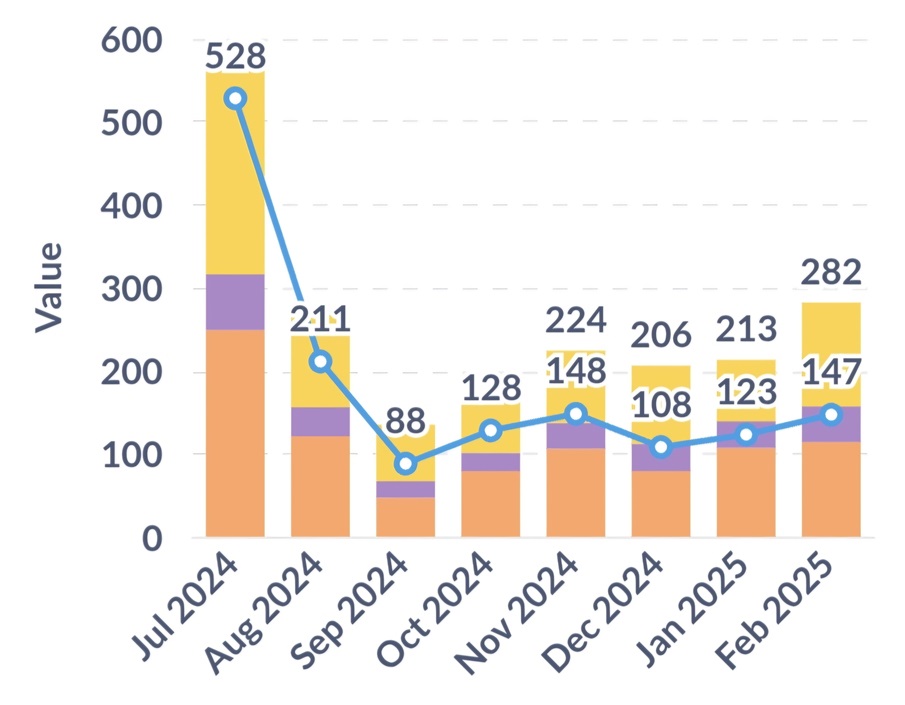
See the detailed image below where the top number is missing for some of the bars. Here is the link to the image ...
I added the image here since I cannot edit the original post. Please note, the first four bars only display the line chart numbers since they are very similar to the monthly totals that are supposed to display above. Thus, if I can get the line chart numbers to display below the data points (circles), I believe the top numbers would then display. How can I make that happen?
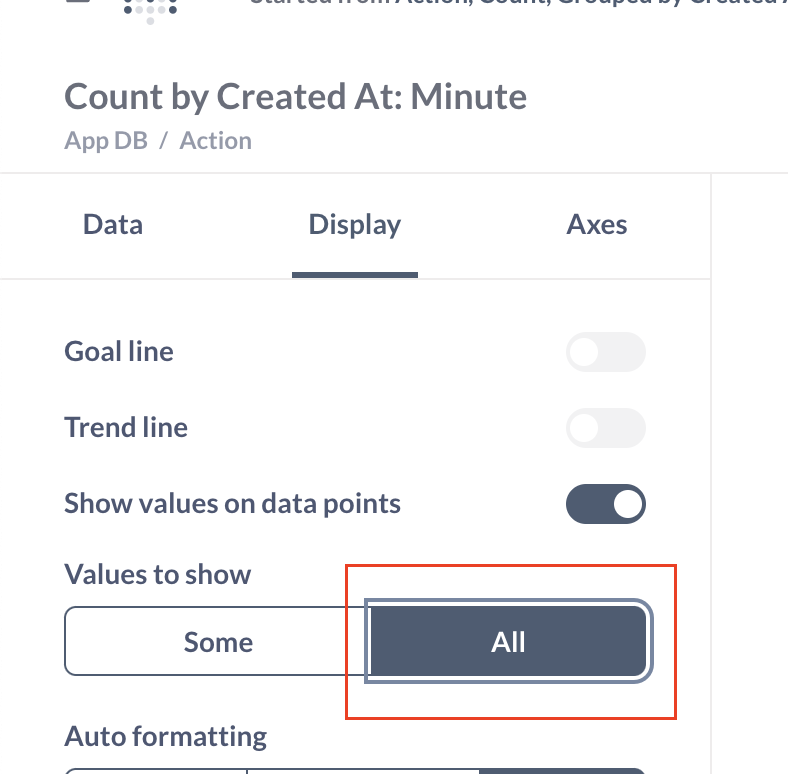
Yes I have that setting. I tried making it larger but couldn't get them all to display since would be on top of each other. I really need them to display below the circles in the line chart instead of above.
You mean instead of a line chart have a 2nd bar next to each? If so, not the look we want. The software should just change the numbers to display below the data points and by definition, it would resolve the issue. Or at least add that option. Thanks for your support!