Numeric values rendering as "January 1, 1970, 12:00 AM"

Dear Metabase team,

First of all, thanks so much for this great tool -- I've been working on developing a Metabase dashboard for my company over the past couple weeks and it has been a lot of fun.

I did, however, stumble upon what I believe to be a glitch -- though perhaps it is something I am doing wrong. In any case, I didn't find anything similar in another post or in any current or archived GitHub issue, so I though I'd share it here:

For some context, I am generating this question with the graphical query builder (NOT in SQL), though this glitch seems to occur regardless of how I generate the result.

I am calculating a rate metric ("unlock rate") in Metabase, using the following custom expression:

CountIf(NOT isnull([Redemption Time])) / CountIf(NOT isnull([Created At]))

to basically calculate the proportion of times a voucher is redeemed over the total number of vouchers that were issued -- within a certain group. Basically a slightly more wordy way of doing COUNT(redemption_time) / COUNT(created_at) in SQL (since there doesn't seem to be a direct translation of the COUNT() function in Metabase) -- but hey, it does the trick and I'm fine with the result.

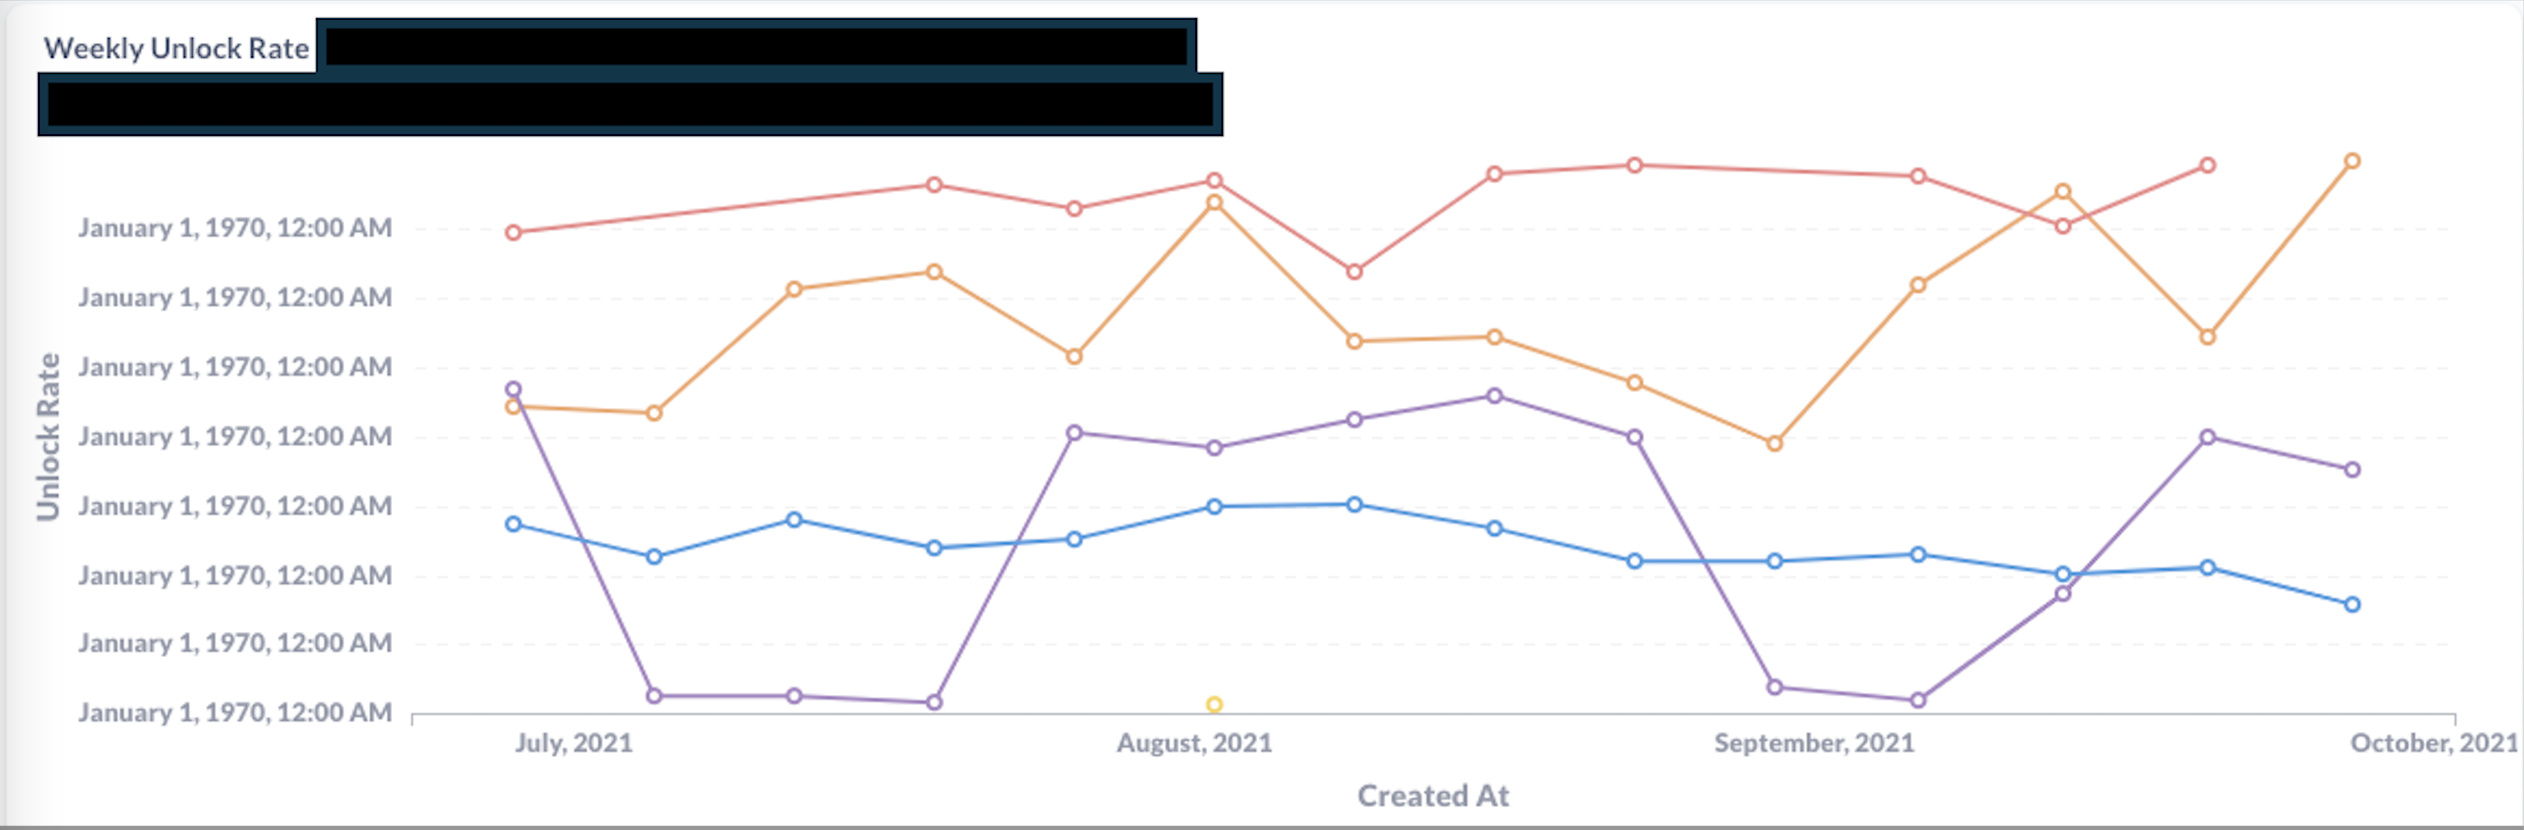
The issue, however, is in the rendering: when I run my graphical query, it generates the data in a date format (it should be a floating point number), where every single value is "January 1, 1970, 12:00 AM":

Interestingly, though, when I run the same query (using the SQL generated by Metabase) anywhere else, I actually do see the values, as normal:

Furthermore, I can confirm that this is a rendering issue (and not a calculating problem), because when I turn the query into a visualization, clearly Metabase has the values under the hood somewhere, because the plot looks exactly how I'd expect!

I've tried changing the style of the data on the chart, but nothing that I try seems to work. Somehow the way that the data is being rendered is "stuck" as a constant date, even though the actual values are hidden somewhere but I cannot access them.

When I generate the same data in SQL (even using the exact query that Metabase generates for me after I do it graphically), everything seems to work fine! So of course, I could simply use SQL in the time-being, although my company would like everything as much as possible to be done graphically, which I also understand to be better for the overall user experience with more on-click options, etc.

Could somebody confirm whether this is indeed a glitch with the graphical query builder, and if so, is there something that I can do to fix it?

Thank you!

Hi @alarmingboots
I cannot reproduce latest release 0.40.5:
https://github.com/metabase/metabase/releases/latest
But your created_at column doesn't look like a regular timestamp, but a string.
Post "Diagnostic Info" from Admin > Troubleshooting, and which database type you're querying.

Hi @flamber,

Sure thing, here is the diagnostic info:

{
  "browser-info": {
    "language": "en-GB",
    "platform": "MacIntel",
    "userAgent": "Mozilla/5.0 (Macintosh; Intel Mac OS X 10_15_7) AppleWebKit/537.36 (KHTML, like Gecko) Chrome/93.0.4577.63 Safari/537.36",
    "vendor": "Google Inc."
  },
  "system-info": {
    "file.encoding": "UTF-8",
    "java.runtime.name": "OpenJDK Runtime Environment",
    "java.runtime.version": "11.0.12+7",
    "java.vendor": "Eclipse Foundation",
    "java.vendor.url": "https://adoptium.net/",
    "java.version": "11.0.12",
    "java.vm.name": "OpenJDK 64-Bit Server VM",
    "java.vm.version": "11.0.12+7",
    "os.name": "Linux",
    "os.version": "5.4.0-70-generic",
    "user.language": "en",
    "user.timezone": "GMT"
  },
  "metabase-info": {
    "databases": [
      "postgres"
    ],
    "hosting-env": "unknown",
    "application-database": "h2",
    "application-database-details": {
      "database": {
        "name": "H2",
        "version": "1.4.197 (2018-03-18)"
      },
      "jdbc-driver": {
        "name": "H2 JDBC Driver",
        "version": "1.4.197 (2018-03-18)"
      }
    },
    "run-mode": "prod",
    "version": {
      "date": "2021-09-09",
      "tag": "v0.40.4",
      "branch": "release-x.40.x",
      "hash": "16d2e53"
    },
    "settings": {
      "report-timezone": null
    }
  }
}

and I am querying PostgreSQL 12.2 (Ubuntu 12.2-4).

@alarmingboots Upgrade to 0.40.5, and migrate away from H2 if you are using Metabase in production:
https://www.metabase.com/docs/latest/operations-guide/migrating-from-h2.html

Can you go to Admin > Data Model > (db) > (table) > (field) gear-icon for both fields.

Then the URL should look like /admin/datamodel/database/1/table/4/123/general where 123 would be the field ID.

And then go to the URL /api/field/123 (for each field), and include the output here (you can redact connection details).

@flamber sure, here are the outputs for both fields:

For the first field:

{
"description": null,
"database_type": "timestamp",
"semantic_type": null,
"table_id": 222,
"coercion_strategy": null,
"table": {
"description": null,
"entity_type": "entity/GenericTable",
"schema": "public",
"db": {
"description": null,
"features": [
"full-join",
"basic-aggregations",
"standard-deviation-aggregations",
"expression-aggregations",
"percentile-aggregations",
"foreign-keys",
"right-join",
"left-join",
"native-parameters",
"nested-queries",
"expressions",
"set-timezone",
"regex",
"case-sensitivity-string-filter-options",
"binning",
"inner-join",
"advanced-math-expressions"
],
"cache_field_values_schedule": "0 0 0 * * ? *",
"timezone": "UTC",
"auto_run_queries": true,
"metadata_sync_schedule": "0 0 * * * ? *",
"name": "...",
"caveats": null,
"is_full_sync": false,
"updated_at": "2021-01-21T17:30:04.176",
"details": {
"additional-options": null,
"ssl": true,
"password": "...",
"let-user-control-scheduling": true,
"port": ...,
"dbname": "...",
"host": "...",
"tunnel-enabled": false,
"user": "..."
},
"is_sample": false,
"id": 2,
"is_on_demand": false,
"options": null,
"engine": "postgres",
"refingerprint": null,
"created_at": "2020-09-15T11:24:19.173",
"points_of_interest": null
},
"show_in_getting_started": false,
"name": "...",
"caveats": null,
"updated_at": "2020-09-29T22:00:00.059",
"entity_name": null,
"active": true,
"id": 222,
"db_id": 2,
"visibility_type": null,
"field_order": "database",
"display_name": "...",
"created_at": "2020-09-15T11:24:20.259",
"points_of_interest": null
},
"name": "...",
"fingerprint_version": 4,
"has_field_values": "none",
"settings": null,
"caveats": null,
"fk_target_field_id": null,
"dimensions": [],
"updated_at": "2020-09-15T12:25:18.143",
"custom_position": 0,
"effective_type": "type/DateTime",
"active": true,
"parent_id": null,
"id": 2596,
"last_analyzed": "2020-09-15T12:47:34.753",
"position": 5,
"visibility_type": "normal",
"preview_display": true,
"display_name": "Redemption Time",
"database_position": 5,
"name_field": null,
"fingerprint": {
"global": {
"distinct-count": 99,
"nil%": 0.9902
},
"type": {
"type/DateTime": {
"earliest": "2016-07-23T14:43:55.668Z",
"latest": "2019-01-06T15:25:44.339Z"
}
}
},
"created_at": "2020-09-15T11:24:32.758",
"base_type": "type/DateTime",
"points_of_interest": null
}

And for the second field:

{
"description": null,
"database_type": "timestamp",
"semantic_type": "type/CreationTimestamp",
"table_id": 222,
"coercion_strategy": null,
"table": {
"description": null,
"entity_type": "entity/GenericTable",
"schema": "public",
"db": {
"description": null,
"features": [
"full-join",
"basic-aggregations",
"standard-deviation-aggregations",
"expression-aggregations",
"percentile-aggregations",
"foreign-keys",
"right-join",
"left-join",
"native-parameters",
"nested-queries",
"expressions",
"set-timezone",
"regex",
"case-sensitivity-string-filter-options",
"binning",
"inner-join",
"advanced-math-expressions"
],
"cache_field_values_schedule": "0 0 0 * * ? *",
"timezone": "UTC",
"auto_run_queries": true,
"metadata_sync_schedule": "0 0 * * * ? *",
"name": "...",
"caveats": null,
"is_full_sync": false,
"updated_at": "2021-01-21T17:30:04.176",
"details": {
"additional-options": null,
"ssl": true,
"password": "...",
"let-user-control-scheduling": true,
"port": ...,
"dbname": "...",
"host": "...",
"tunnel-enabled": false,
"user": "..."
},
"is_sample": false,
"id": 2,
"is_on_demand": false,
"options": null,
"engine": "postgres",
"refingerprint": null,
"created_at": "2020-09-15T11:24:19.173",
"points_of_interest": null
},
"show_in_getting_started": false,
"name": "...",
"caveats": null,
"updated_at": "2020-09-29T22:00:00.059",
"entity_name": null,
"active": true,
"id": 222,
"db_id": 2,
"visibility_type": null,
"field_order": "database",
"display_name": "...",
"created_at": "2020-09-15T11:24:20.259",
"points_of_interest": null
},
"name": "created_at",
"fingerprint_version": 4,
"has_field_values": "none",
"settings": null,
"caveats": null,
"fk_target_field_id": null,
"dimensions": [],
"updated_at": "2020-09-15T12:47:34.426",
"custom_position": 0,
"effective_type": "type/DateTime",
"active": true,
"parent_id": null,
"id": 2600,
"last_analyzed": "2020-09-15T12:47:34.753",
"position": 4,
"visibility_type": "normal",
"preview_display": true,
"display_name": "...",
"database_position": 4,
"name_field": null,
"fingerprint": {
"global": {
"distinct-count": 10000,
"nil%": 0
},
"type": {
"type/DateTime": {
"earliest": "2016-07-15T10:01:17.586Z",
"latest": "2017-05-21T09:13:53.717Z"
}
}
},
"created_at": "2020-09-15T11:24:32.759",
"base_type": "type/DateTime",
"points_of_interest": null
}

@alarmingboots No matter what I try, I cannot reproduce.

@flamber I see -- all good! Thanks for trying!

In that case I'll have to upgrade to the next (latest) version and try the H2 migration thing, as you suggested. I'll report back after that's done and see if that fixed the problem.