Hi everyone,
I'm currently working on an aggregated sales dashboard, and I'm facing a couple of challenges that I hope someone could help me with:
-
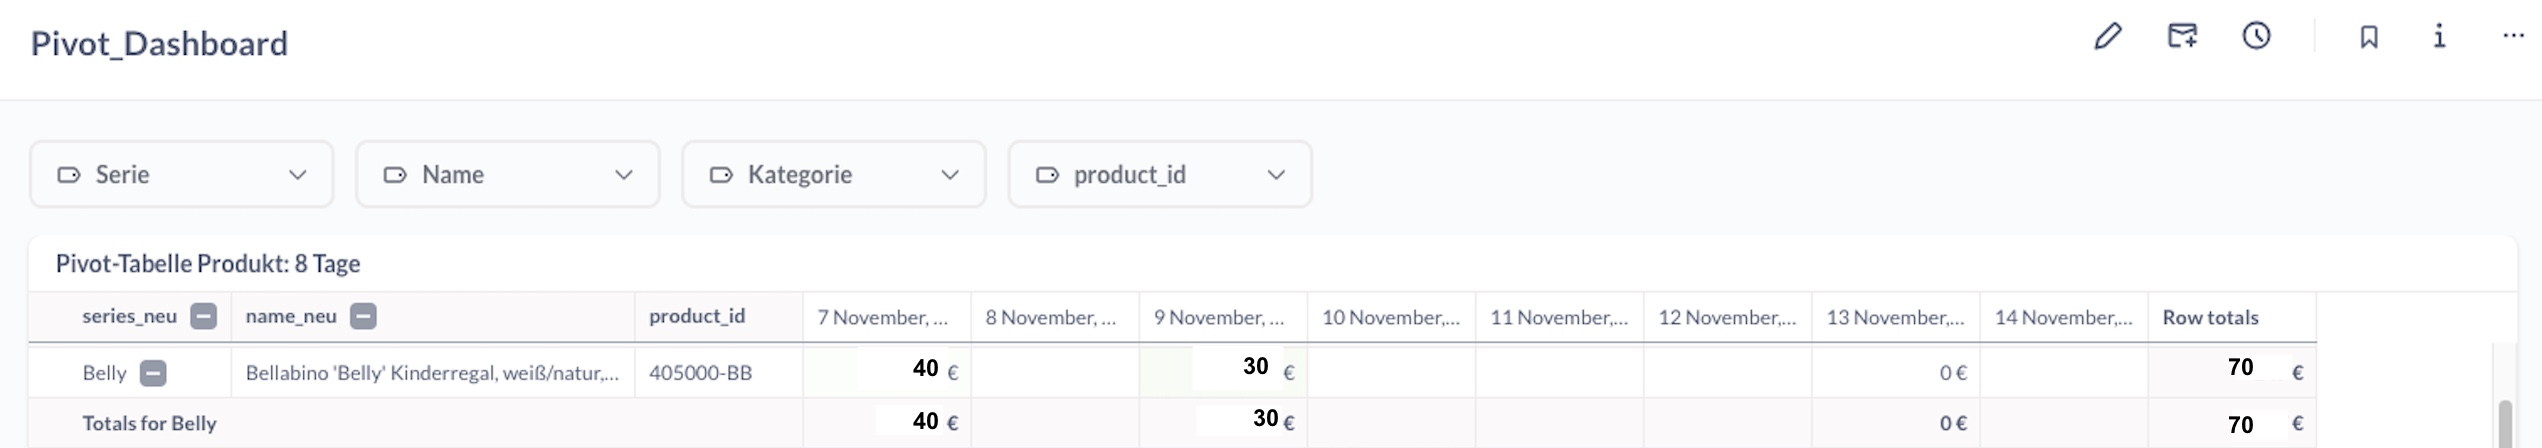
Changing the Placement of "Totals for Belly":
I'm trying to figure out how to place the raw "Totals for Belly" before the individual product names. As it stands, the general sum is appearing after all the product names, and I couldn't find a feature to rearrange this. It's not very user-friendly to have the overall sum buried at the end, and ideally, I'd like to have it displayed differently. -
Sorting Rows Based on Series Totals:
Another issue I'm grappling with is sorting the rows in a way that the series with the highest "Totals of series per row" appears first in the dashboard, followed by the second highest, and so on. I'm not sure how to achieve this sorting logic effectively. I mean, this raw "Totals" is created by the meta base automatically, if you click on the feature, that means, that I can't adjust it in the table, before I create the visualization. However, probably there is a trick or I understand it false. I want that for example Series_neu "Campo" if it has bigger Total value will be shown at the top, and than the Belly, because the total sum of campo is bigger.
Any insights or guidance on these matters would be greatly appreciated. Thanks in advance for your help!