Recently users can't edit graph colors...
Not sure what I did wrong!
Help is greatly appreciated!
This is a video of how the page worked in the past: 250603_editing colors MPG and IDLE Slide 4 - TechSmith Screencast
-g
Recently users can't edit graph colors...
Not sure what I did wrong!
Help is greatly appreciated!
This is a video of how the page worked in the past: 250603_editing colors MPG and IDLE Slide 4 - TechSmith Screencast
-g
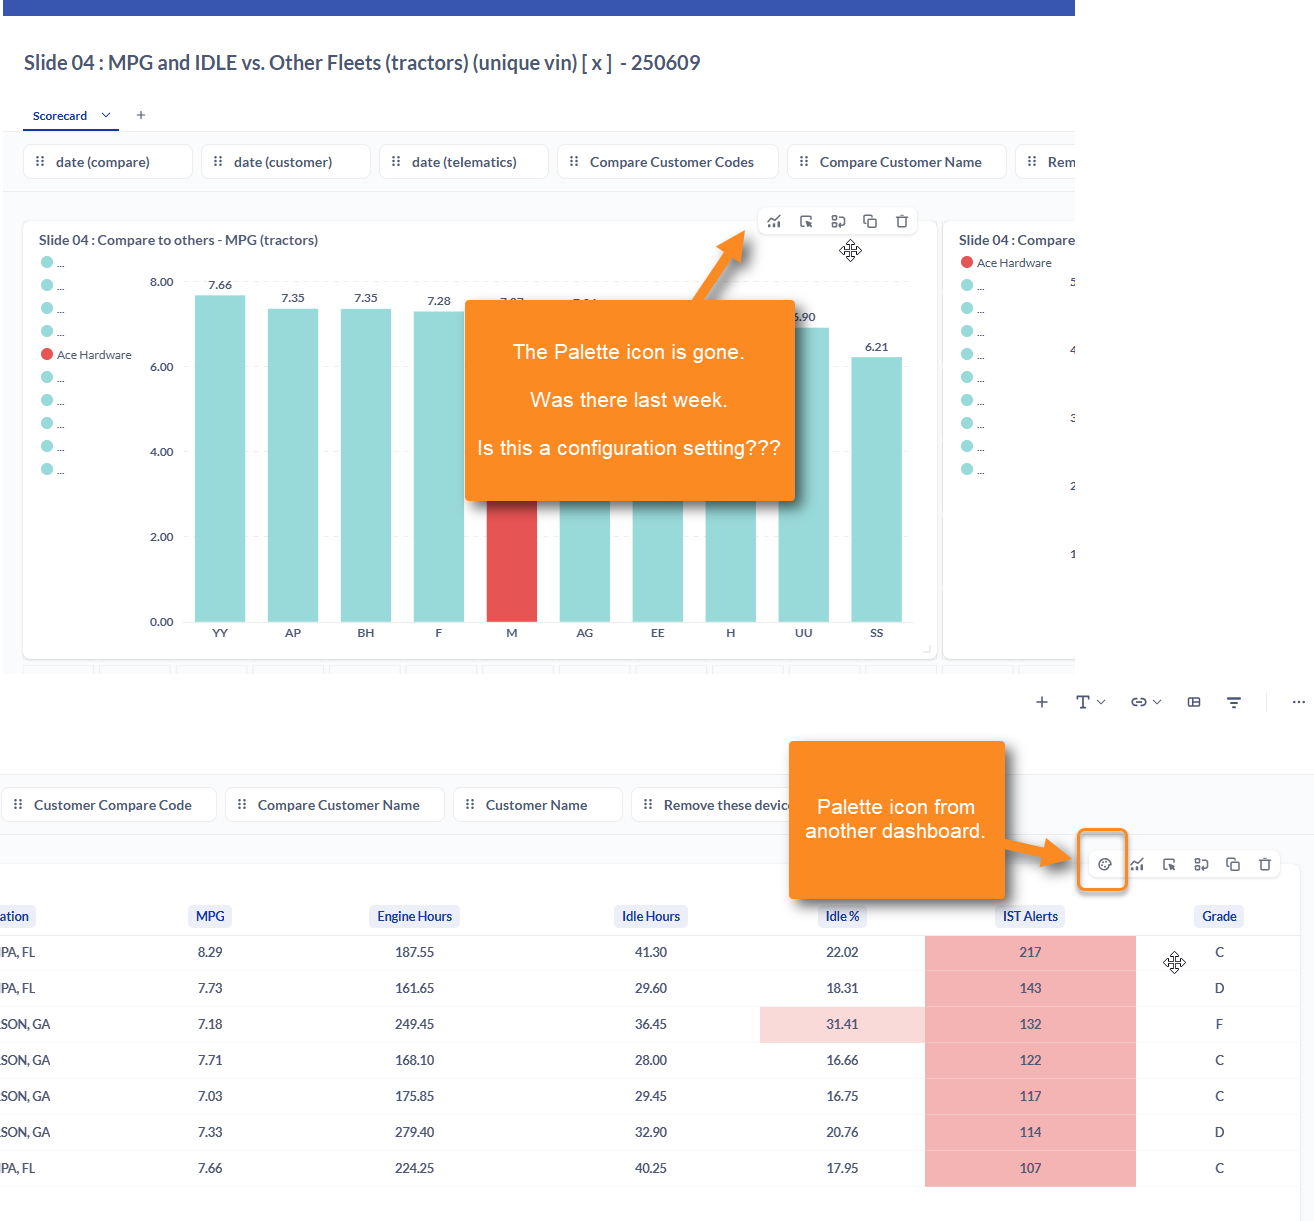
This is one of those fun quirks about Metabase.
There's two different types of chart cards in dashboards.
If you click the three-dots menu on the card outside of edit mode, it will say "Edit question" for Questions and "Edit visualization" for Visualizations.
The palette icon ("Visualization Options") only appears on cards of the Question type. It'll appear next to it's buddy, the combo chart icon ("Visualize another way").
On cards of a Visualization type, only the Visualization Options button appears, and in that case it's the combo chart icon.
In your case, the first card is being treated as a Visualization, and clicking the combo chart icon there will bring up the in-place viz editor. The second card is treated as a Question and both the Visualization Options and Visualize Another Way buttons are there. In that situation the Visualization Options button pulls up a reduced viz editor (note no data column picker on the left).
You can edit colors, etc. in either situation by clicking the buttons you have highlighted in your screenshot.
I haven't quite figured out which card is created in which context, and sometimes version upgrades or edits to the card will change the type without any warning. If any devs have any guidance on the what and why of this I'd love to know. ![]()
Thanks for the insight and kind response!
Will let you know what I find ![]()
This topic was automatically closed 3 days after the last reply. New replies are no longer allowed.