Hey folks - relatively new to Metabase and I'm trying to build some dashboards to give users a snapshot view of the business.
One thing I'm noticing is that there's a lack of any feature which allows MoM comparisons.
I've found the trend visual which gives me one KPI and corresponding % change from the previous date interval, but ideally, I'd be looking to have this for many KPI's at the same time. It feels like quite a common scenario that I see when reporting in other tools (PowerBI, Tableau) and was surprised to see that there's nothing to support it in Metabase.
Does anybody have any workarounds?
So far I've attempted:
- Using the Trend visual for all 6 KPI's (very messy, too much information to absorb and not user friendly)
- Creating a separate data source which Pivot's the data and building a separate visual for the % difference. Whilst trying to align these side-by-side I found out that there's a limit to how narrow the visual can be so this doesn't work as an option either.
Open to suggestions on how others have solved this!
Hi @danilo_nzyte
Sounds like you’re looking for one or several of these - upvote by clicking  on the first post:
https://github.com/metabase/metabase/issues/9598
https://github.com/metabase/metabase/issues/4257
https://github.com/metabase/metabase/issues/9393
https://github.com/metabase/metabase/issues/10273
Are those questions build using SQL or GUI? It should be possible to do everything in SQL, but still a bit messy query.
1 Like
Looks like you’re right with regards to the first one.
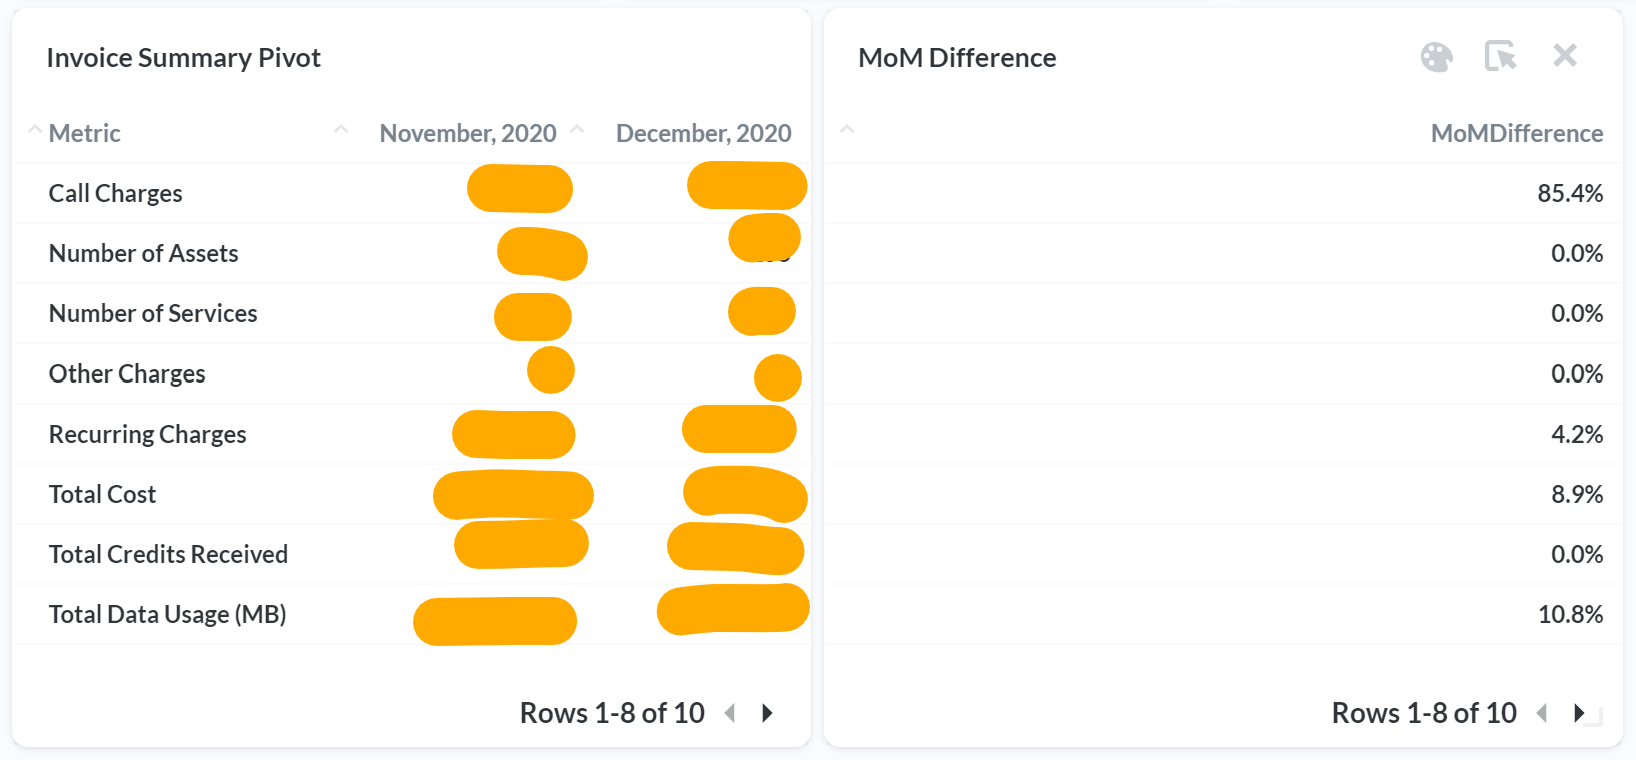
They are built with SQL - I don’t mind a messy query to get the job done in the interim, but there’s no way that I can fathom where I can have two metrics in a Pivot Table view, and ultimately I need the absolute numbers (which have been highlighted over) and the MoM Difference next to them.
I’m struggling to think of another way to visualise the data with such a large number of metrics.
@danilo_nzyte
Return a data-set like this: Name | Period | Value
And then you’ll do a little union between the two queries and return “MoMDifference” with a hardcoded period - like so Name | "MoMDifference" | Value
You will likely have to convert periods to strings, and perhaps the values too.
That’s the hacky way to do what you’re trying to - I think, based on your screenshot.
Pivot tables will get a major overhaul in the upcoming 0.38 (you can try the release candidate), but it won’t currently be able to do what you’re looking for - it’s just a step in that direction:
https://github.com/metabase/metabase/releases
 on the first post: