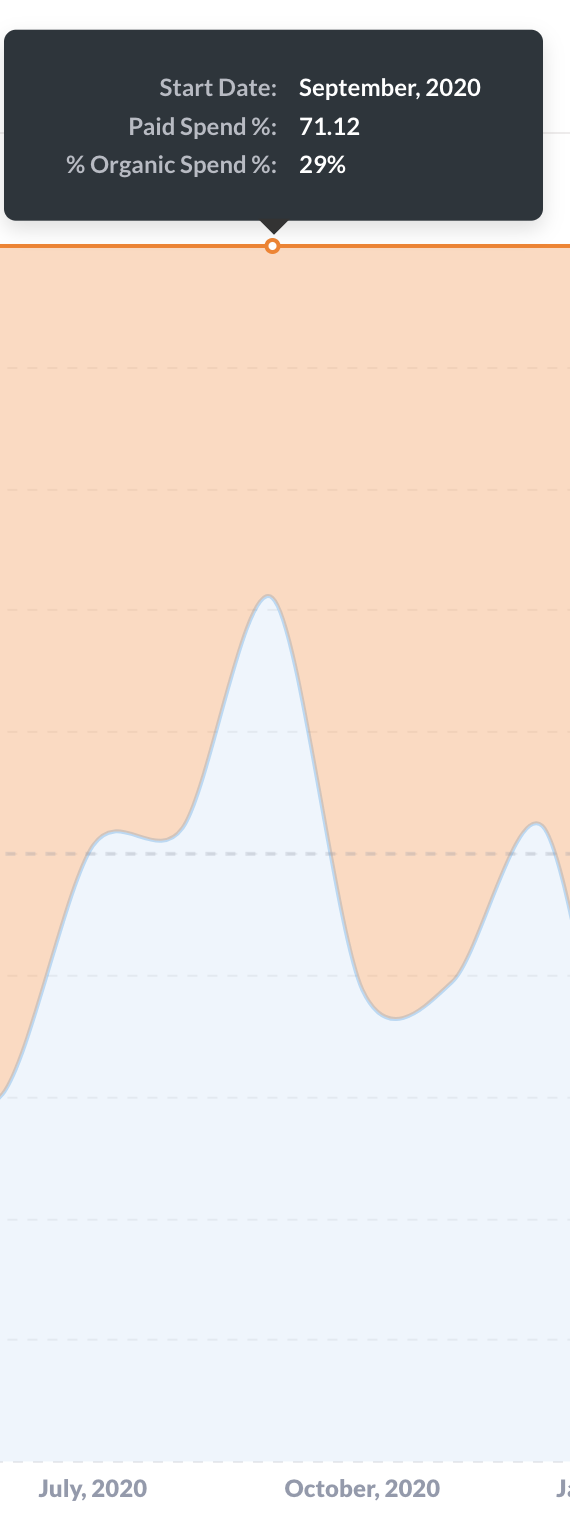
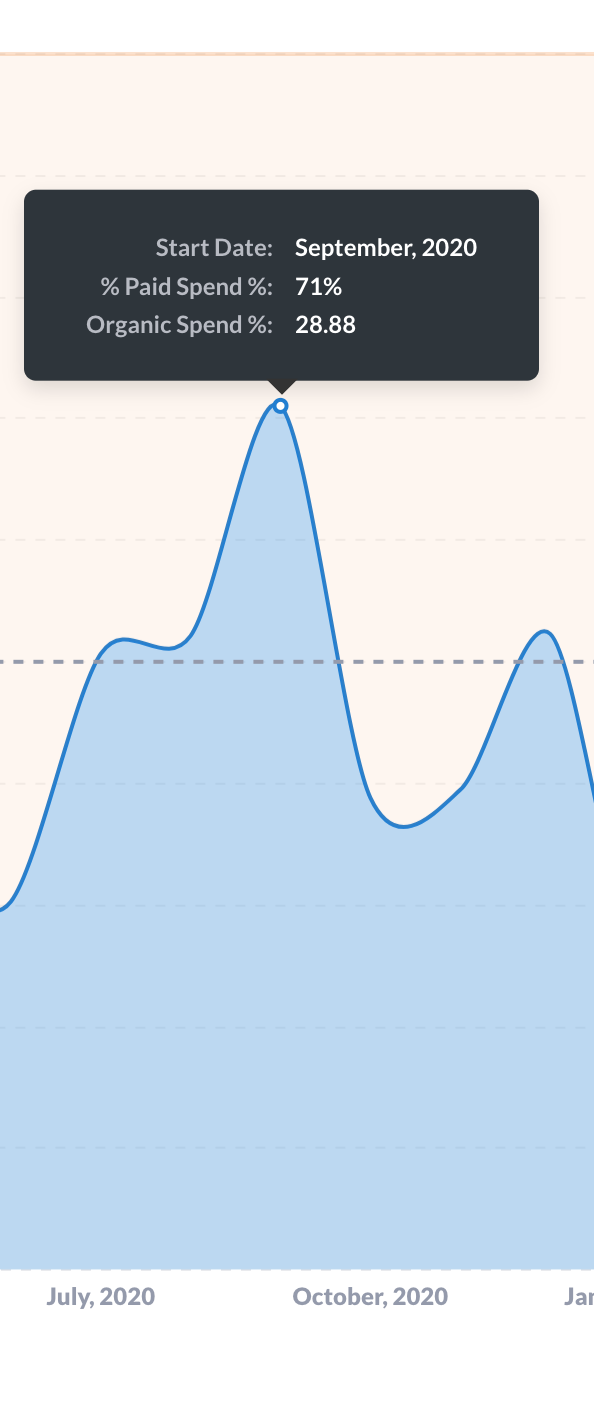
Seeing an issue on an area visualisation where data points on the chart are showing as normal numbers and the other number as a percentage (both 'styles' are 'normal') , on the other data point in the chart, this appears reversed. The data in the chart can be seen on the second screenshot.
Also seeing an additional % appear before the name of the column i.e. "% Organic Spend %"
Question Data
{
description: null,
archived: false,
collection_position: null,
table_id: 30,
result_metadata: [
{
description: null,
semantic_type: "type/CreationDate",
coercion_strategy: null,
unit: "month",
name: "start_date",
settings: null,
field_ref: [
"field",
138,
{
temporal-unit: "month"
}
],
effective_type: "type/DateTimeWithLocalTZ",
id: 138,
visibility_type: "normal",
display_name: "Start Date",
fingerprint: {
global: {
distinct-count: 77,
nil%: 0.7081967213114754
},
type: {
type/DateTime: {
earliest: "2019-04-23",
latest: "2021-11-22"
}
}
},
base_type: "type/DateTimeWithLocalTZ"
},
{
display_name: "Paid Spend %",
field_ref: [
"aggregation",
0
],
name: "Paid Spend %",
base_type: "type/Float",
effective_type: "type/Float",
semantic_type: null,
fingerprint: {
global: {
distinct-count: 31,
nil%: 0
},
type: {
type/Number: {
min: 21.72260432899182,
q1: 31.84754053576612,
q3: 51.74417002115948,
max: 84.05407421811488,
sd: 15.882259578067268,
avg: 43.824917452130094
}
}
}
},
{
display_name: "Organic Spend %",
field_ref: [
"aggregation",
1
],
name: "Organic Spend %",
base_type: "type/Float",
effective_type: "type/Float",
semantic_type: null,
fingerprint: {
global: {
distinct-count: 31,
nil%: 0
},
type: {
type/Number: {
min: 15.945925781885112,
q1: 48.25582997884052,
q3: 68.15245946423389,
max: 78.27739567100818,
sd: 15.88225957806727,
avg: 56.175082547869906
}
}
}
}
],
creator: {
email: "ed.sparks@goatagency.com",
first_name: "Ed",
last_login: "2022-09-21T18:44:07.417747Z",
is_qbnewb: false,
is_superuser: true,
id: 1,
last_name: "Sparks",
date_joined: "2021-11-17T21:42:03.283057Z",
common_name: "Ed Sparks"
},
can_write: true,
database_id: 2,
enable_embedding: false,
collection_id: 15,
query_type: "query",
name: "Organic vs Ad Spend MoM",
last_query_start: "2022-09-26T15:07:38.415561Z",
dashboard_count: 1,
average_query_time: 1813.7222222222222,
creator_id: 1,
moderation_reviews: [ ],
updated_at: "2022-09-26T15:13:09.490679Z",
made_public_by_id: null,
embedding_params: null,
cache_ttl: null,
dataset_query: {
database: 2,
query: {
source-table: 30,
joins: [
{
fields: "none",
source-table: 42,
condition: [
"=",
[
"field",
134,
null
],
[
"field",
53,
{
join-alias: "Activations"
}
]
],
alias: "Activations"
},
{
fields: "none",
source-table: 117,
condition: [
"=",
[
"field",
51,
{
join-alias: "Activations"
}
],
[
"field",
875,
{
join-alias: "Adsets"
}
]
],
alias: "Adsets"
},
{
fields: "none",
source-table: 119,
condition: [
"=",
[
"field",
874,
{
join-alias: "Adsets"
}
],
[
"field",
885,
{
join-alias: "Ads"
}
]
],
alias: "Ads"
},
{
fields: "none",
source-table: 61,
condition: [
"=",
[
"field",
134,
null
],
[
"field",
552,
{
join-alias: "Posts"
}
]
],
alias: "Posts"
}
],
aggregation: [
[
"aggregation-options",
[
"*",
[
"/",
[
"sum",
[
"field",
904,
{
join-alias: "Ads"
}
]
],
[
"sum",
[
"+",
[
"field",
539,
{
join-alias: "Posts"
}
],
[
"field",
904,
{
join-alias: "Ads"
}
]
]
]
],
100
],
{
name: "Paid Spend %",
display-name: "Paid Spend %"
}
],
[
"aggregation-options",
[
"*",
[
"/",
[
"sum",
[
"field",
539,
{
join-alias: "Posts"
}
]
],
[
"sum",
[
"+",
[
"field",
539,
{
join-alias: "Posts"
}
],
[
"field",
904,
{
join-alias: "Ads"
}
]
]
]
],
100
],
{
name: "Organic Spend %",
display-name: "Organic Spend %"
}
]
],
breakout: [
[
"field",
138,
{
temporal-unit: "month"
}
]
],
filter: [
"and",
[
"not-null",
[
"field",
530,
{
join-alias: "Posts"
}
]
],
[
"not-null",
[
"field",
888,
{
join-alias: "Ads"
}
]
],
[
"=",
[
"field",
553,
{
join-alias: "Posts"
}
],
"paid",
"Contracted",
"contracted"
],
[
">",
[
"field",
539,
{
join-alias: "Posts"
}
],
0
],
[
">",
[
"field",
904,
{
join-alias: "Ads"
}
],
0
],
[
">",
[
"field",
138,
null
],
"2020-01-01"
]
]
},
type: "query"
},
id: 471,
parameter_mappings: [ ],
display: "area",
entity_id: "HpLK3IhrGjK823Uarzfs_",
collection_preview: true,
last-edit-info: {
id: 1,
email: "ed.sparks@goatagency.com",
first_name: "Ed",
last_name: "Sparks",
timestamp: "2022-09-26T15:13:09.606113Z"
},
visualization_settings: {
graph.show_goal: true,
graph.show_trendline: true,
pivot_table.column_split: {
rows: [
[
"field",
138,
{
temporal-unit: "month"
}
]
],
columns: [ ],
values: [
[
"aggregation",
0
],
[
"aggregation",
1
]
]
},
graph.show_values: false,
graph.x_axis.labels_enabled: true,
graph.goal_label: "50%",
stackable.stack_display: "area",
graph.y_axis.labels_enabled: true,
graph.goal_value: 0.5,
graph.y_axis.scale: "linear",
graph.y_axis.auto_split: true,
graph.label_value_frequency: "all",
graph.metrics: [
"Paid Spend %",
"Organic Spend %"
],
graph.label_value_formatting: "auto",
column_settings: {
["name","Paid Spend %"]: {
number_style: "decimal"
},
["name","Organic Spend %"]: {
number_style: "decimal"
}
},
series_settings: {
Paid Spend %: {
color: "#227FD2",
line.interpolate: "cardinal",
line.marker_enabled: false,
line.missing: "interpolate"
},
Organic Spend %: {
color: "#ED8535",
line.interpolate: "cardinal",
line.marker_enabled: false
}
},
graph.y_axis.auto_range: true,
graph.x_axis.scale: "timeseries",
graph.dimensions: [
"start_date"
],
stackable.stack_type: "normalized"
},
collection: {
authority_level: null,
description: null,
archived: false,
slug: "management",
color: "#509EE3",
name: "Management",
personal_owner_id: null,
id: 15,
entity_id: "mXlW3he0bDr0Do1sHHjQ_",
location: "/",
namespace: null
},
parameters: [ ],
dataset: false,
created_at: "2022-09-21T19:13:33.663225Z",
public_uuid: null
}
Diagnostic Info
{
  "browser-info": {
    "language": "en-GB",
    "platform": "MacIntel",
    "userAgent": "Mozilla/5.0 (Macintosh; Intel Mac OS X 10_15_7) AppleWebKit/537.36 (KHTML, like Gecko) Chrome/105.0.0.0 Safari/537.36",
    "vendor": "Google Inc."
  },
  "system-info": {
    "file.encoding": "UTF-8",
    "java.runtime.name": "OpenJDK Runtime Environment",
    "java.runtime.version": "11.0.16.1+1-LTS",
    "java.vendor": "Azul Systems, Inc.",
    "java.vendor.url": "http://www.azul.com/",
    "java.version": "11.0.16.1",
    "java.vm.name": "OpenJDK 64-Bit Server VM",
    "java.vm.version": "11.0.16.1+1-LTS",
    "os.name": "Linux",
    "os.version": "4.4.0-1104-aws",
    "user.language": "en",
    "user.timezone": "Etc/UTC"
  },
  "metabase-info": {
    "databases": [
      "postgres",
      "h2"
    ],
    "hosting-env": "heroku",
    "application-database": "postgres",
    "application-database-details": {
      "database": {
        "name": "PostgreSQL",
        "version": "13.8 (Ubuntu 13.8-1.pgdg20.04+1)"
      },
      "jdbc-driver": {
        "name": "PostgreSQL JDBC Driver",
        "version": "42.4.1"
      }
    },
    "run-mode": "prod",
    "version": {
      "date": "2022-09-02",
      "tag": "v0.44.3",
      "branch": "release-x.44.x",
      "hash": "7d50282"
    },
    "settings": {
      "report-timezone": null
    }
  }
}