For a ‘month to date’ comparison between this month and last, I came up with the query below. You can apply a Trend viz to that query and have it compare to Previous Month and it will compare the two months to date (as of the end of yesterday/start of today).
‘X to date’ type queries can be a bit complicated as the precise specification differs depending on the range. For months you can use days of the month, but for years you can either use day-of-year (watch out for leap years) or a date bracketed between date_trunc(‘year’, created_at) and date_trunc(‘day’, created_at). You can also explicitly check date parts with EXTRACT().
In some cases you can use window functions with a RANGE qualifier (this is what the MBQL offset function does).
The trick is to output the desired dates as timestamps; the Trend viz can do the math after that. It never actually displays the date, so you can fool it into picking the intervals you want.
The query (using Sample Database, PostgreSQL syntax is similar but the interval spec is slightly different):
select
date_trunc('month', created_at) as the_month,
sum(total) as month_to_date
from orders
where
-- This keeps it from calculating MTD for every month in the DB
created_at > date_trunc('month', current_timestamp) - interval '1' MONTH
and created_at < current_timestamp
-- This limits to day-of-month-to-date
and extract(day from created_at) < extract(day from current_timestamp)
group by date_trunc('month', created_at)
order by date_trunc('month', created_at)
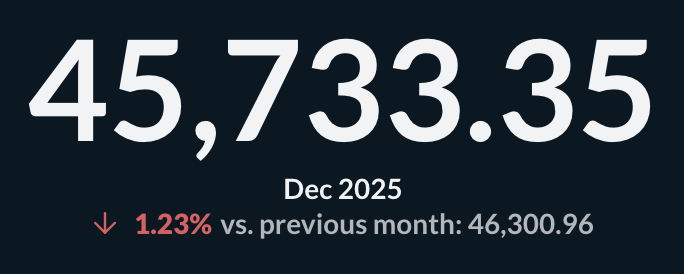
This outputs 2 rows like:
Nov 1, 2025, 12:00 AM 46,300.96
Dec 1, 2025, 12:00 AM 45,733.35
Then the query to extract a certain period to date will (example Month to Date):
Select all dates from period start to as_of
Join metrics on:
- date_day for current
- prev_month_same_dom for previous period
- prev_year_same_dom for prior year
Aggregate to a single value per comparison
I think this method is scalable and easy to replicate on all variants (e.g. week to date, quarter to date). And also it has no issues in relation to edge cases (eg. MTD comparing Dec (31 days) vs Nov (30 days) on the 31st.