After switching from version 0.23.1 to 0.24.1 we've noticed an strange behaviour on some of our questions. We have a few queries, created in SQL native, pointing to an Oracle DB which are failing to render both in the dashboard and in the question tab.
I'll try to explain it with an specific example in order to be more clear about this issue. We have a query like this:
SELECT SUM(CASE WHEN ((PROB_PROD_DES='XXXXXX' OR PROB_PVER_DES IN 'XXXXXX') AND TO_CHAR(PROB_FEC_ALTA, 'YYYY-MM-DD') = TO_CHAR(sysdate, 'YYYY-MM-DD')) THEN 1 ELSE 0 END) AS Incidents, TESTADO.EST_DES_EN AS Status
FROM ADMIN_HELPDESK.TPROBLEMA INNER JOIN ADMIN_HELPDESK.TESTADO ON TPROBLEMA.PROB_EST_ID=ADMIN_HELPDESK.TESTADO.EST_ID
GROUP BY TESTADO.EST_DES_EN
ORDER BY TESTADO.EST_DES_EN ASC
We use this query to perform a count of the number of rows grouping them by their status. Even if there's no results for one specific status, it will show us its name and a "0" in the count column. We've set this question to be visualized as a pie chart, and before switching to v.0.24.1, it was working fine. In case there were no records in a determinate moment, it will perform the query an remain in blank (Sometimes it was showing a "0 Total"), which was fine for us.
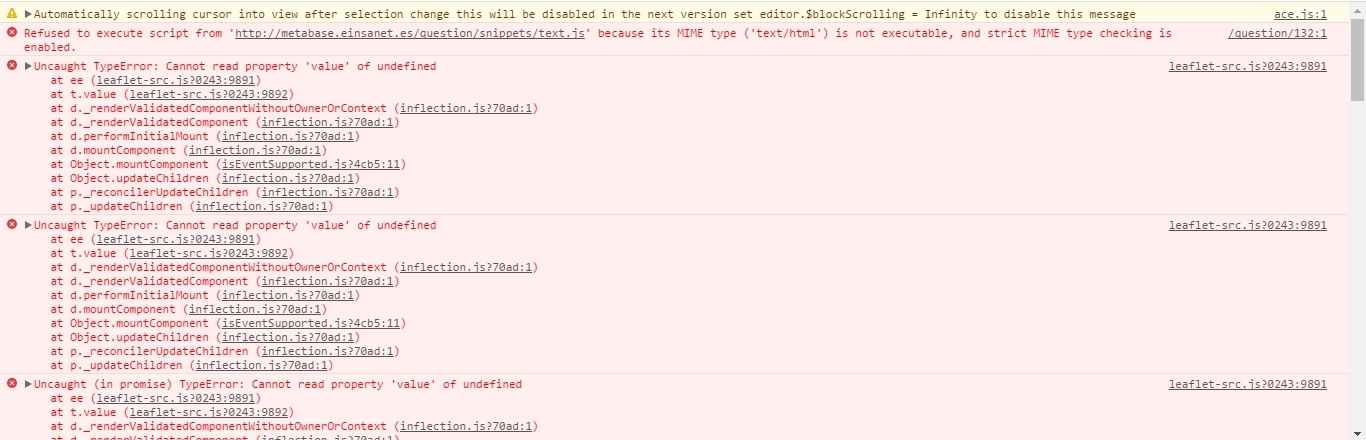
After switching to v0.24.1 those questions, when there aren't any records, can't be rendered. Its cards keep on spinning eternally, until any record satisfies the query. In that moment, it's rendered fine. If we switch the visualization to "Table" mode, it will be shown properly, even if there isn't any record. When this problem arises, this is what we can see on Chrome's developer tools:
After digging a little bit more into this behaviour, it seems that this may not be related neither to CASE statements nor Oracle, but to a problem when trying to visualize some rows with value 0 in a pie chart.
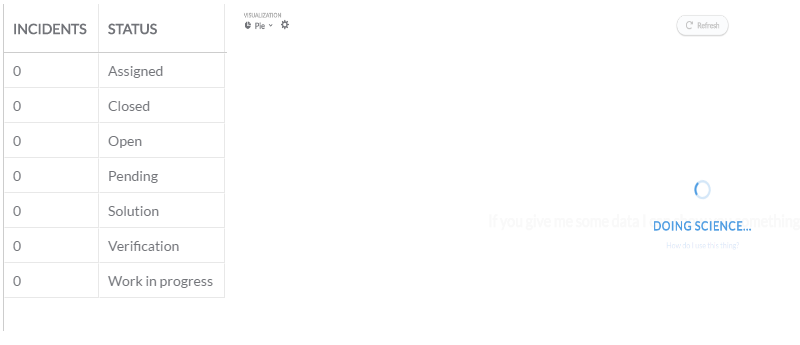
We have a Dashboard where we have some pie charts to show the number of incidents created on the current day grouping them by their status. We use the query from the first post to do so. Why do we use a case statement instead of just perform a count and group the results by their status? Because that's the only way we have to consolidate the colors of the legend within the dashboard. As long as we have one pie chart for each of our products, we need them to show the same colour for each of the possible status. As you would know, there's no way to assign them manually on a pie chart, so the only way we could thought of to achieve this was to perform a case statement and return all the possible status even if their count for the current moment is zero, so we could order by this field and have the same colours over the different cards.This problem, we noticed when switching from version 0.23.1 to 0.24.1, arises when any of those pie charts have 0 results for each of the possible status.
In that moment, and until any of the possible status returns a result, it will keep on spinning and won't show anything at all. Here's an example, the result in table mode (on the left) and the attempt of showing it in a pie chart (on the right):
Has anyone noticed this behaviour? Just to add more info about it, when this problem affects one of a Dashboard's cards, all the other cards at the same level (position in the dashboard) or below the one with this problem won't render too. They will all keep on spinning until the card with this problem returns a result. Until that moment, This Dashboard's edit mode is faulty. You can drag cards but it won't allow you to drop , resize or perform any change at all on them.