Hi there
I'm not sure if I overlooked something on how to pivot a pivot table properly. I've seen many Github tickets closed so I think this has been solved.
I have replicated it with the test data this simple query:
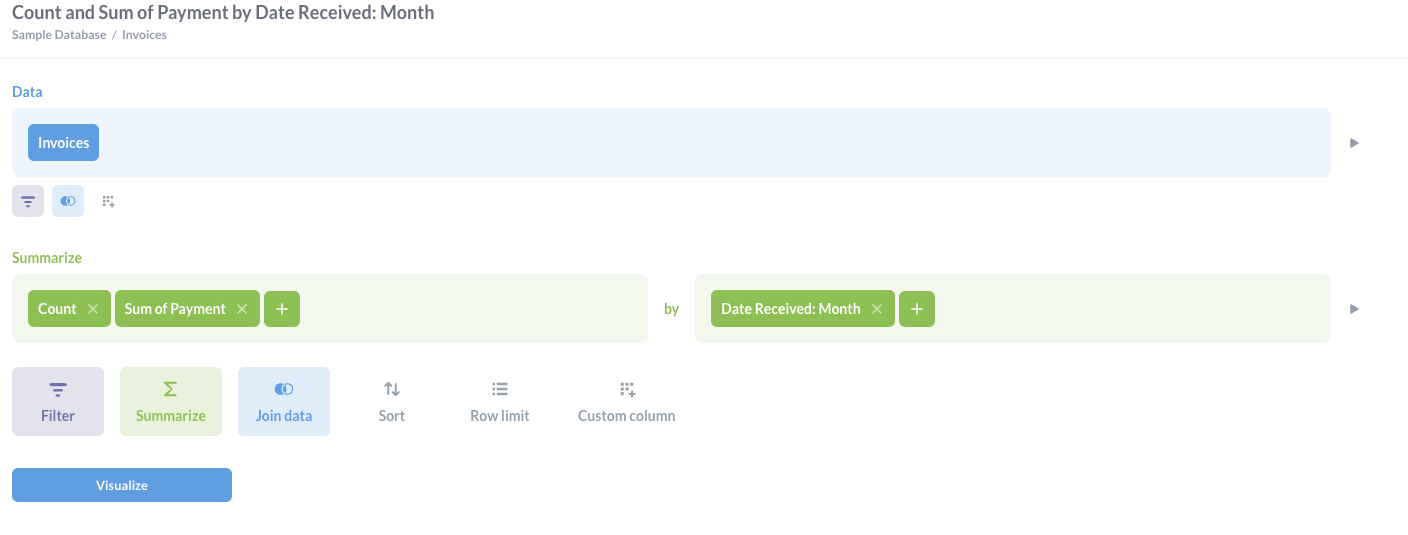
Now I have this pivot table visualisation:
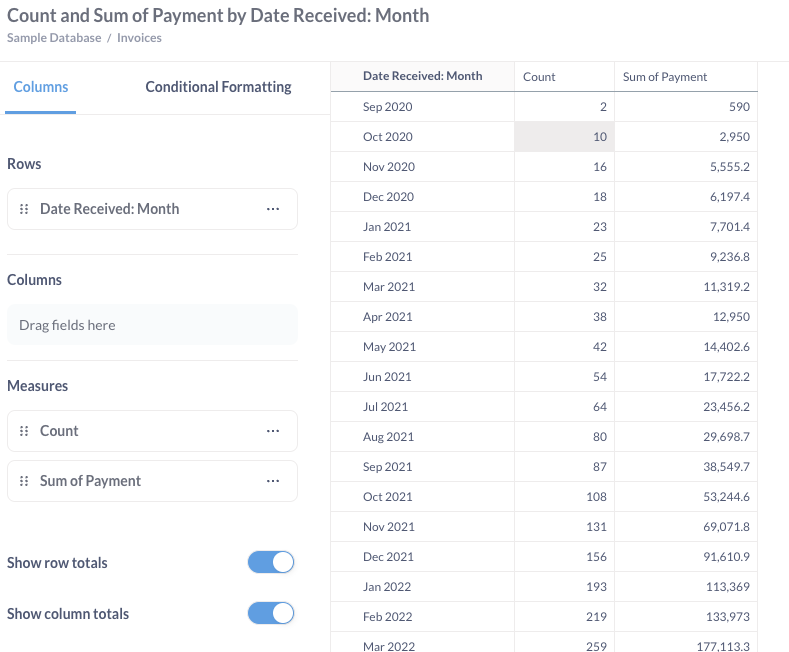
And that's basically the data I want to see but as you probably can guess just rows and columns flipped. So having 2 rows: Count and Sum of Payment and the columns are just the months.
I don't seem to be able to configure it that way. When I move the date to columns, the table gets blank and I also can't move the measures to the rows.
Is that really not possible or am I missing something?
Thanks,
Christian
PS: I also tried to use the normal table option with its pivot functionality but doesn't work either with that.