Hi,
At work, we utilize it as a support for frontend developers. I want to create a pivot table by the following table description: a table with 2 group columns and 2 descriptive columns. Is it possible?
Best regards,
Bruno Peixoto
Hi,
At work, we utilize it as a support for frontend developers. I want to create a pivot table by the following table description: a table with 2 group columns and 2 descriptive columns. Is it possible?
Best regards,
Bruno Peixoto
Hi @brunolnetto
Yes, the Pivot Table visualization supports multiple rows, columns and values:
https://www.metabase.com/docs/latest/users-guide/05-visualizing-results.html#pivot-table
Given:
groups c11, c12, c13 in col_1, each with groups c111, c112, groups c121, c122, c123 and groups c131, c132 in col_2 , and col_3 and col_4 give respectively some descriptive value. Could you explain how do I generate a table without repeating the values of grouped row (an equivalent to "merge cell" in excel).
@brunolnetto I don't use Excel. Perhaps you're looking for this:
https://github.com/metabase/metabase/issues/18024 - upvote by clicking  on the first post.
The feature I wish is called hierarchical index, available in python-pandas:
https://pandas.pydata.org/pandas-docs/stable/reference/api/pandas.DataFrame.groupby.html
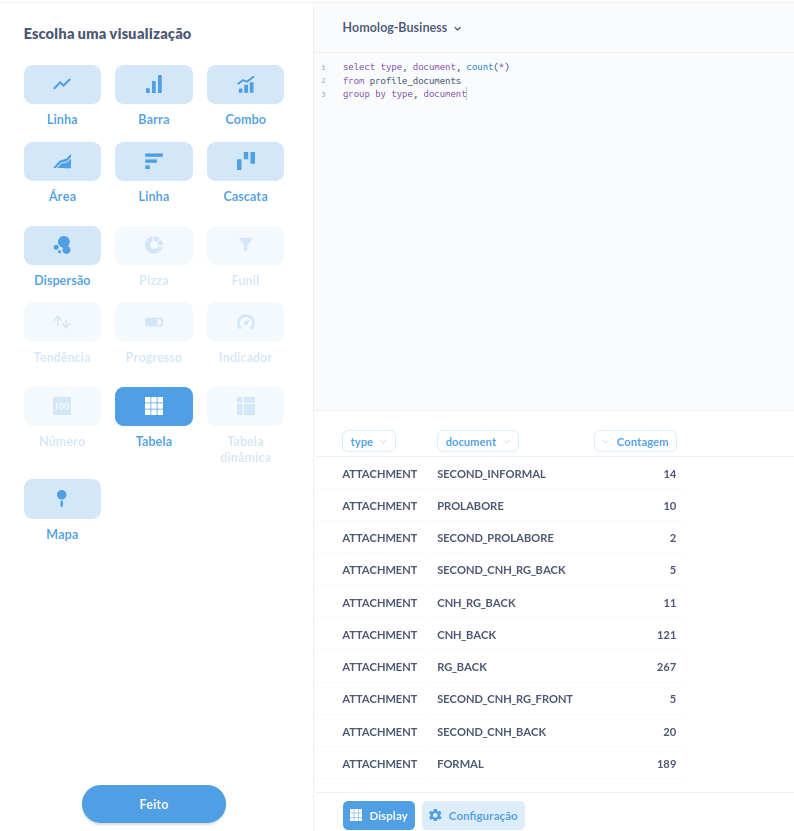
An additional example, despite fulfillment of aggregation requirement, is: why doesn't the pivot table appear for me as a possible visualization table below?
@brunolnetto From the documentation I already linked to:
Redirecting…
They don’t work for questions that lack aggregate data, and they don’t work for questions written in SQL, as Metabase would need to modify your SQL code in order to calculate subtotals. If you really need to use SQL, the workaround here is to create your question in two steps: first do all the complex things you need to do in SQL, save the results as a question, then use that saved SQL question as the starting point for a new GUI question which summarizes that data