Hello, I want to make a pivot table from a delivery list.
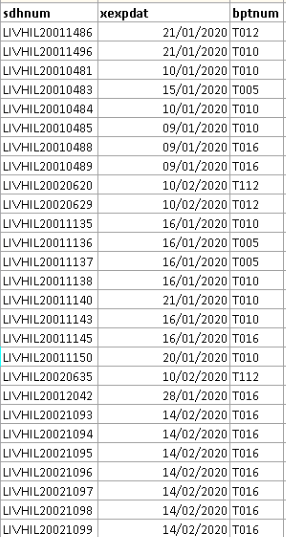
I have 3 fields: sdhnum (delivery slip number), xexpdat (shipping date, bptnum (carrier identifier).
I want to be able to browse the table filtering by carrier and display data by year / month and count the number of deliveries for each set.
Example of my data:
Example of the expected result with Excel
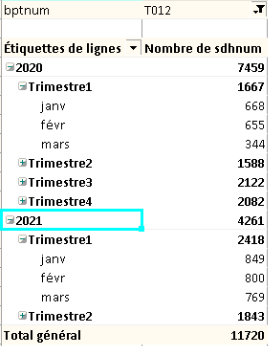
I cannot create the year / quarter / month detail in the same view.
Is this possible without having to click on each element to go down in detail?
I'm use Metabase 0.39.3
Thank you in advance.
 on the first post