Hi @domjammoo
Please post “Diagnostic Info” from Admin > Troubleshooting, and which database you are querying.
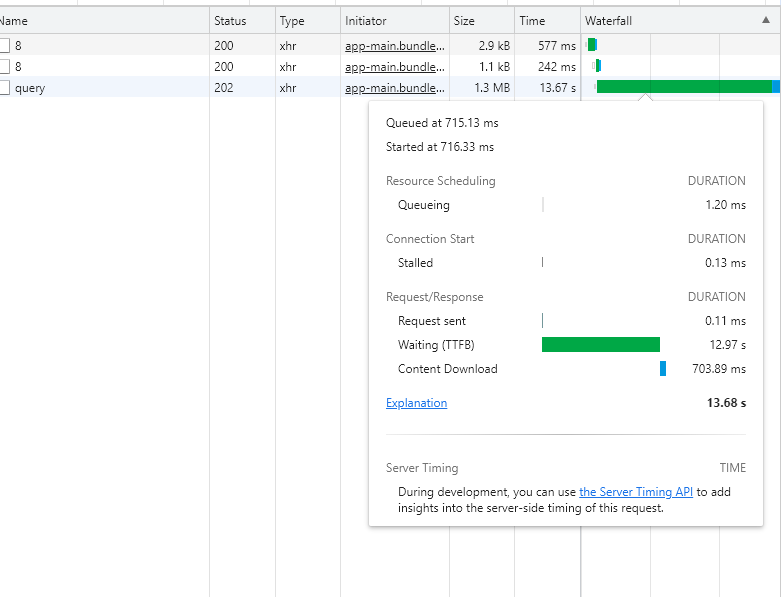
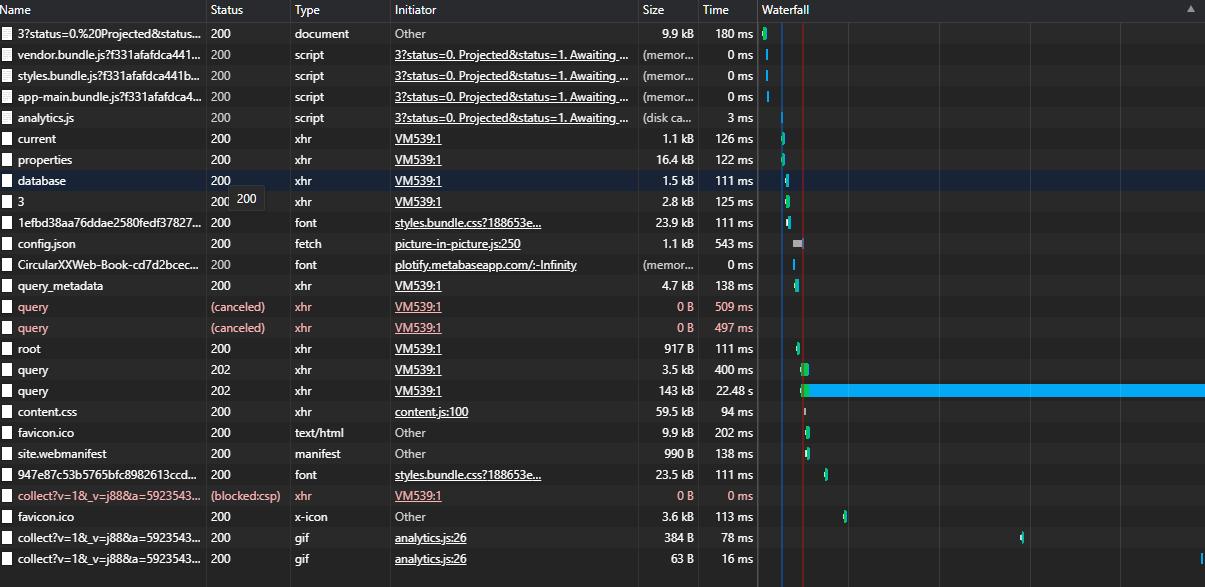
Check the browser developer Network-tab and click the request to see the response-data, which also includes the query - you might want to run the query directly on your database with EXPLAIN ANALYZE prepended to see if it is an indexing problem.
@domjammoo
You might be querying Postgres 12, but the Metabase application database you’re using is Postgres 11.7
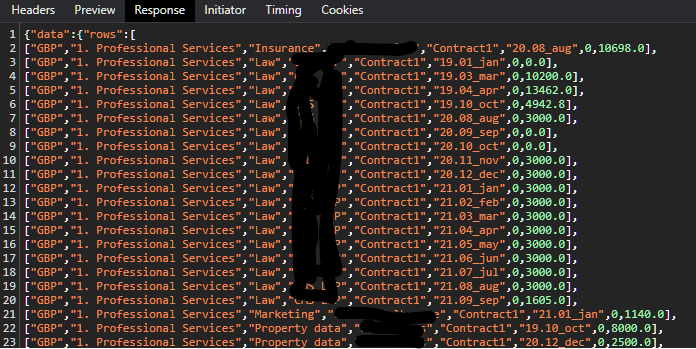
Click the request and check the Response-tab - or enable debug logging on your Postgres to see the query.
Are you an Enterprise customer or using Metabase Cloud?
Running from Navicat, I get 0.069 seconds. It's a tiny, development table at this point, only 286 rows in total, and the entire query is based on a single view.
If I run it in Metabase as a direct SQL query, again it is instantaneous.
On the dashboard, at the moment it's taking 22 seconds.
I have a bar chart on the same dashboard, querying the same view, but with fewer dimensions (3 dimensions instead of 8). This loads instantly. In viewing the network response, I note that:
The bar chart returns 240 rows from the SQL query, and generates a response array of 59 arrays (59 rows) with three elements per array.
The pivot table, returning the same 240 rows in SQL, returns an array of 6,893 arrays, with 8 elements per array. It looks like it creates 240 arrays, and then a sequential number indicating the column in the pivot, and then the value. My x-axis (column headings) in the pivot are month periods, there are a few gaps but roughly ~25-30 to 30 so that's where the 6893 number is coming from.
Is that the problem do you think, writing the 6k array, or rendering it in the client?
Unfortunately, pivot tables are my core use case, my goal is providing self-service analytics to my operations and sales teams and, without this basic capability, I can’t get the team off excel.
@domjammoo I don’t think I’m fully understanding what you mean by 6893 arrays. Each row is returned as single array with multiple keys - one key for each column.
So there should be 240 rows, which means 240 arrays, where each array contains 8 keys, so the total amount of keys should be 1920.
There’s a key running_time in the main object (usually at the bottom), which is the millisecond time of the query that Metabase gets from the driver.
If you run the exact same question, but with regular Table visualization, does that change the speed?
I have tried multiple different databases with various schemas and I cannot make Pivot Table slow in any noticeable way compared to regular tables.
But I’m noticing that you’re returning 143KB of data, which seems like a lot for just 240 rows with 8 columns.
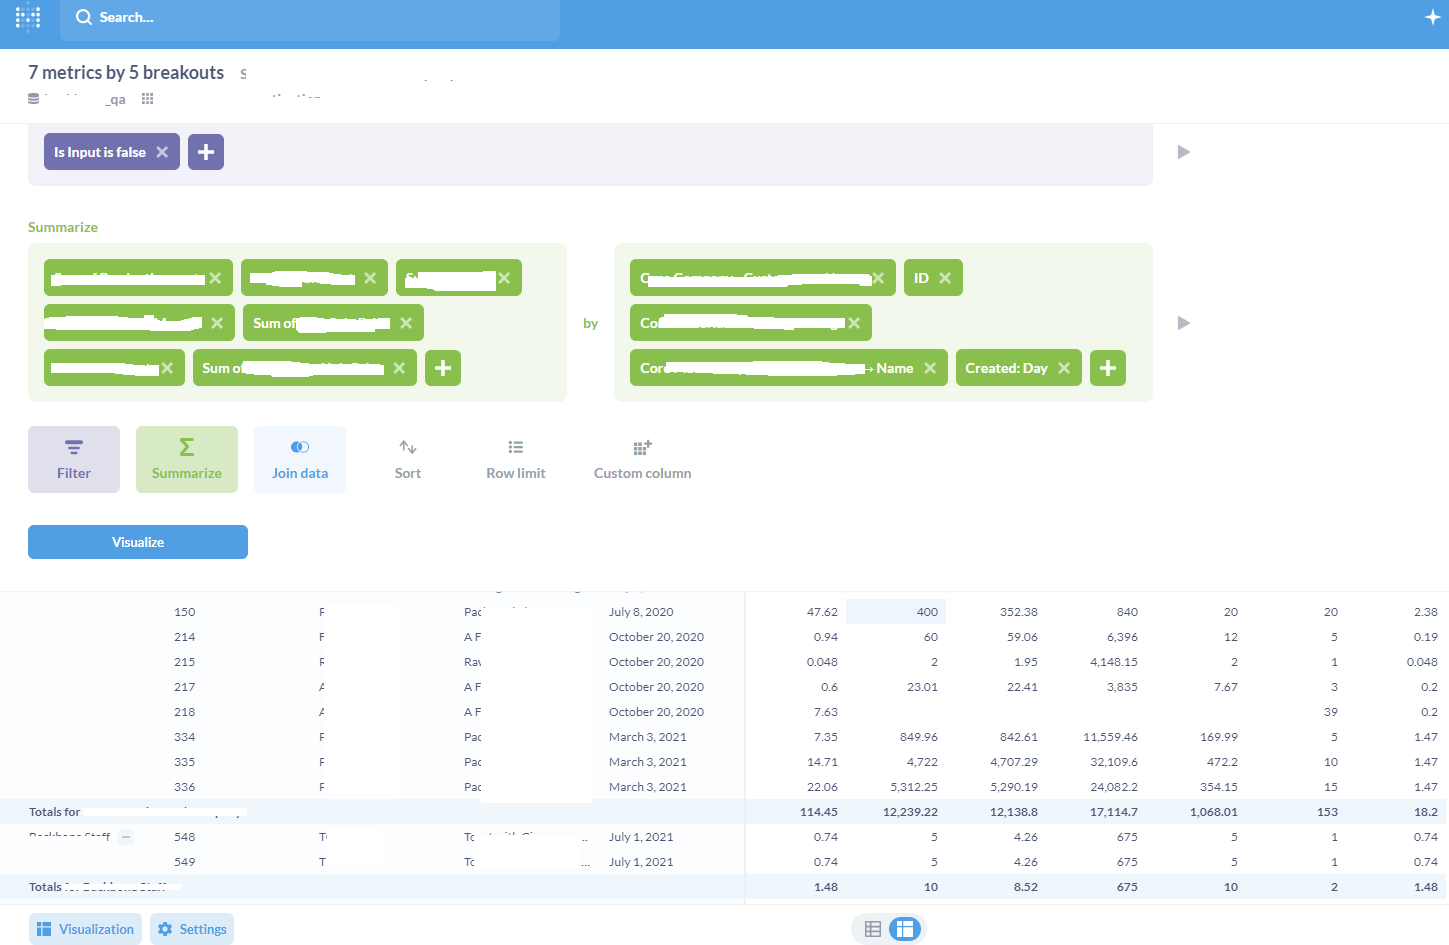
So this is what the pivot looks like (i've redacted some stuff) - you can see not many rows; and 37 columns (3x12 months plus a total). Most of the intersections are blank
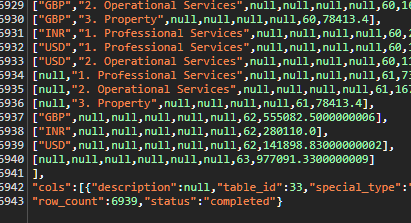
The penultimate column goes up to 63 (not sure why), repeating most (but not all) of the 240 rows, which gives us 6,940 (the numbers have gone up since before)
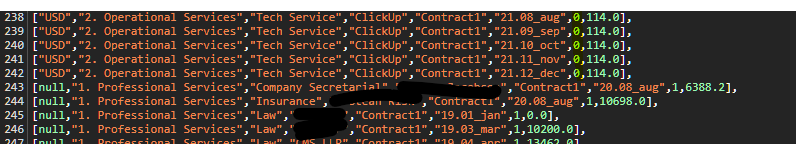
What is slightly peculiar is, for example, I have one row that only has a single value in a single month (6,388.2). This is then included in 32 different rows:
If I change the visualization to a table (so the 'month' value that is used for the column headings becomes just another column), then, yes, it just runs instantaneously and returns 240 rows.
Lastly, this is the pivot table definition: nothing complicated:
Hello, is there any progress with this issue? We face exactly the same problem. Data is retrieved in a few seconds, simple table is rendered in few seconds, but the same question with pivot table visualisation is taking almost minute to render.
@martin.melisik Every sub-total is a separate query, so depending on how many sub-totals you have, then there's a lot of queries - so this depends on your database and latency too, and specially missing indexes can cause a lot of temporary tables, but you can only see such information if you enable debugging on your database.
Hello @flamber, is it expected that the data returned from pivot query is duplicated like stated above? It seems to happen on v0.38.3 also, and it slow things down.
Hi, it also seems that pivot table from dashboard is significantly slower than in question. We used the same filter in both: question (900 ms), dashboard (8100 ms). Why ? Is there any way to speed it up ?
Hello, have the same problem!
In my query seven summarized fields and six grouped.
SQL question returns a response for 1 sec, if using pivot table it loads 15 seconds. When I removed two grouped fields pivot tables become loading for 5 seconds.
At the same time, It looks like a problem with UI. When I switch between query editor and pivot table it slows down and freezing.
@ksvsem
Metabase does a query for each of the grouped fields to create sub-totals for those, so the more groupings you have, the more queries will be made to your database.
If you just return a single table, then only a single query is made.
As for the UI, that sounds like a different problem. When you say "query editor", what does that mean? The Notebook Editor?
"query editor" means "Custom question editor"
When I click the "Visualize" button it takes 15 sec to load, but if I use the same queries from "SQL for this question" it loads in "Native query" for 1 sec.

 .
.