Hello,
I have being trying to display different amounts of sessions for a chosen time period in a single graph with not much success. What I mean by this is that I can't seem to be able to filter on the date correctly.
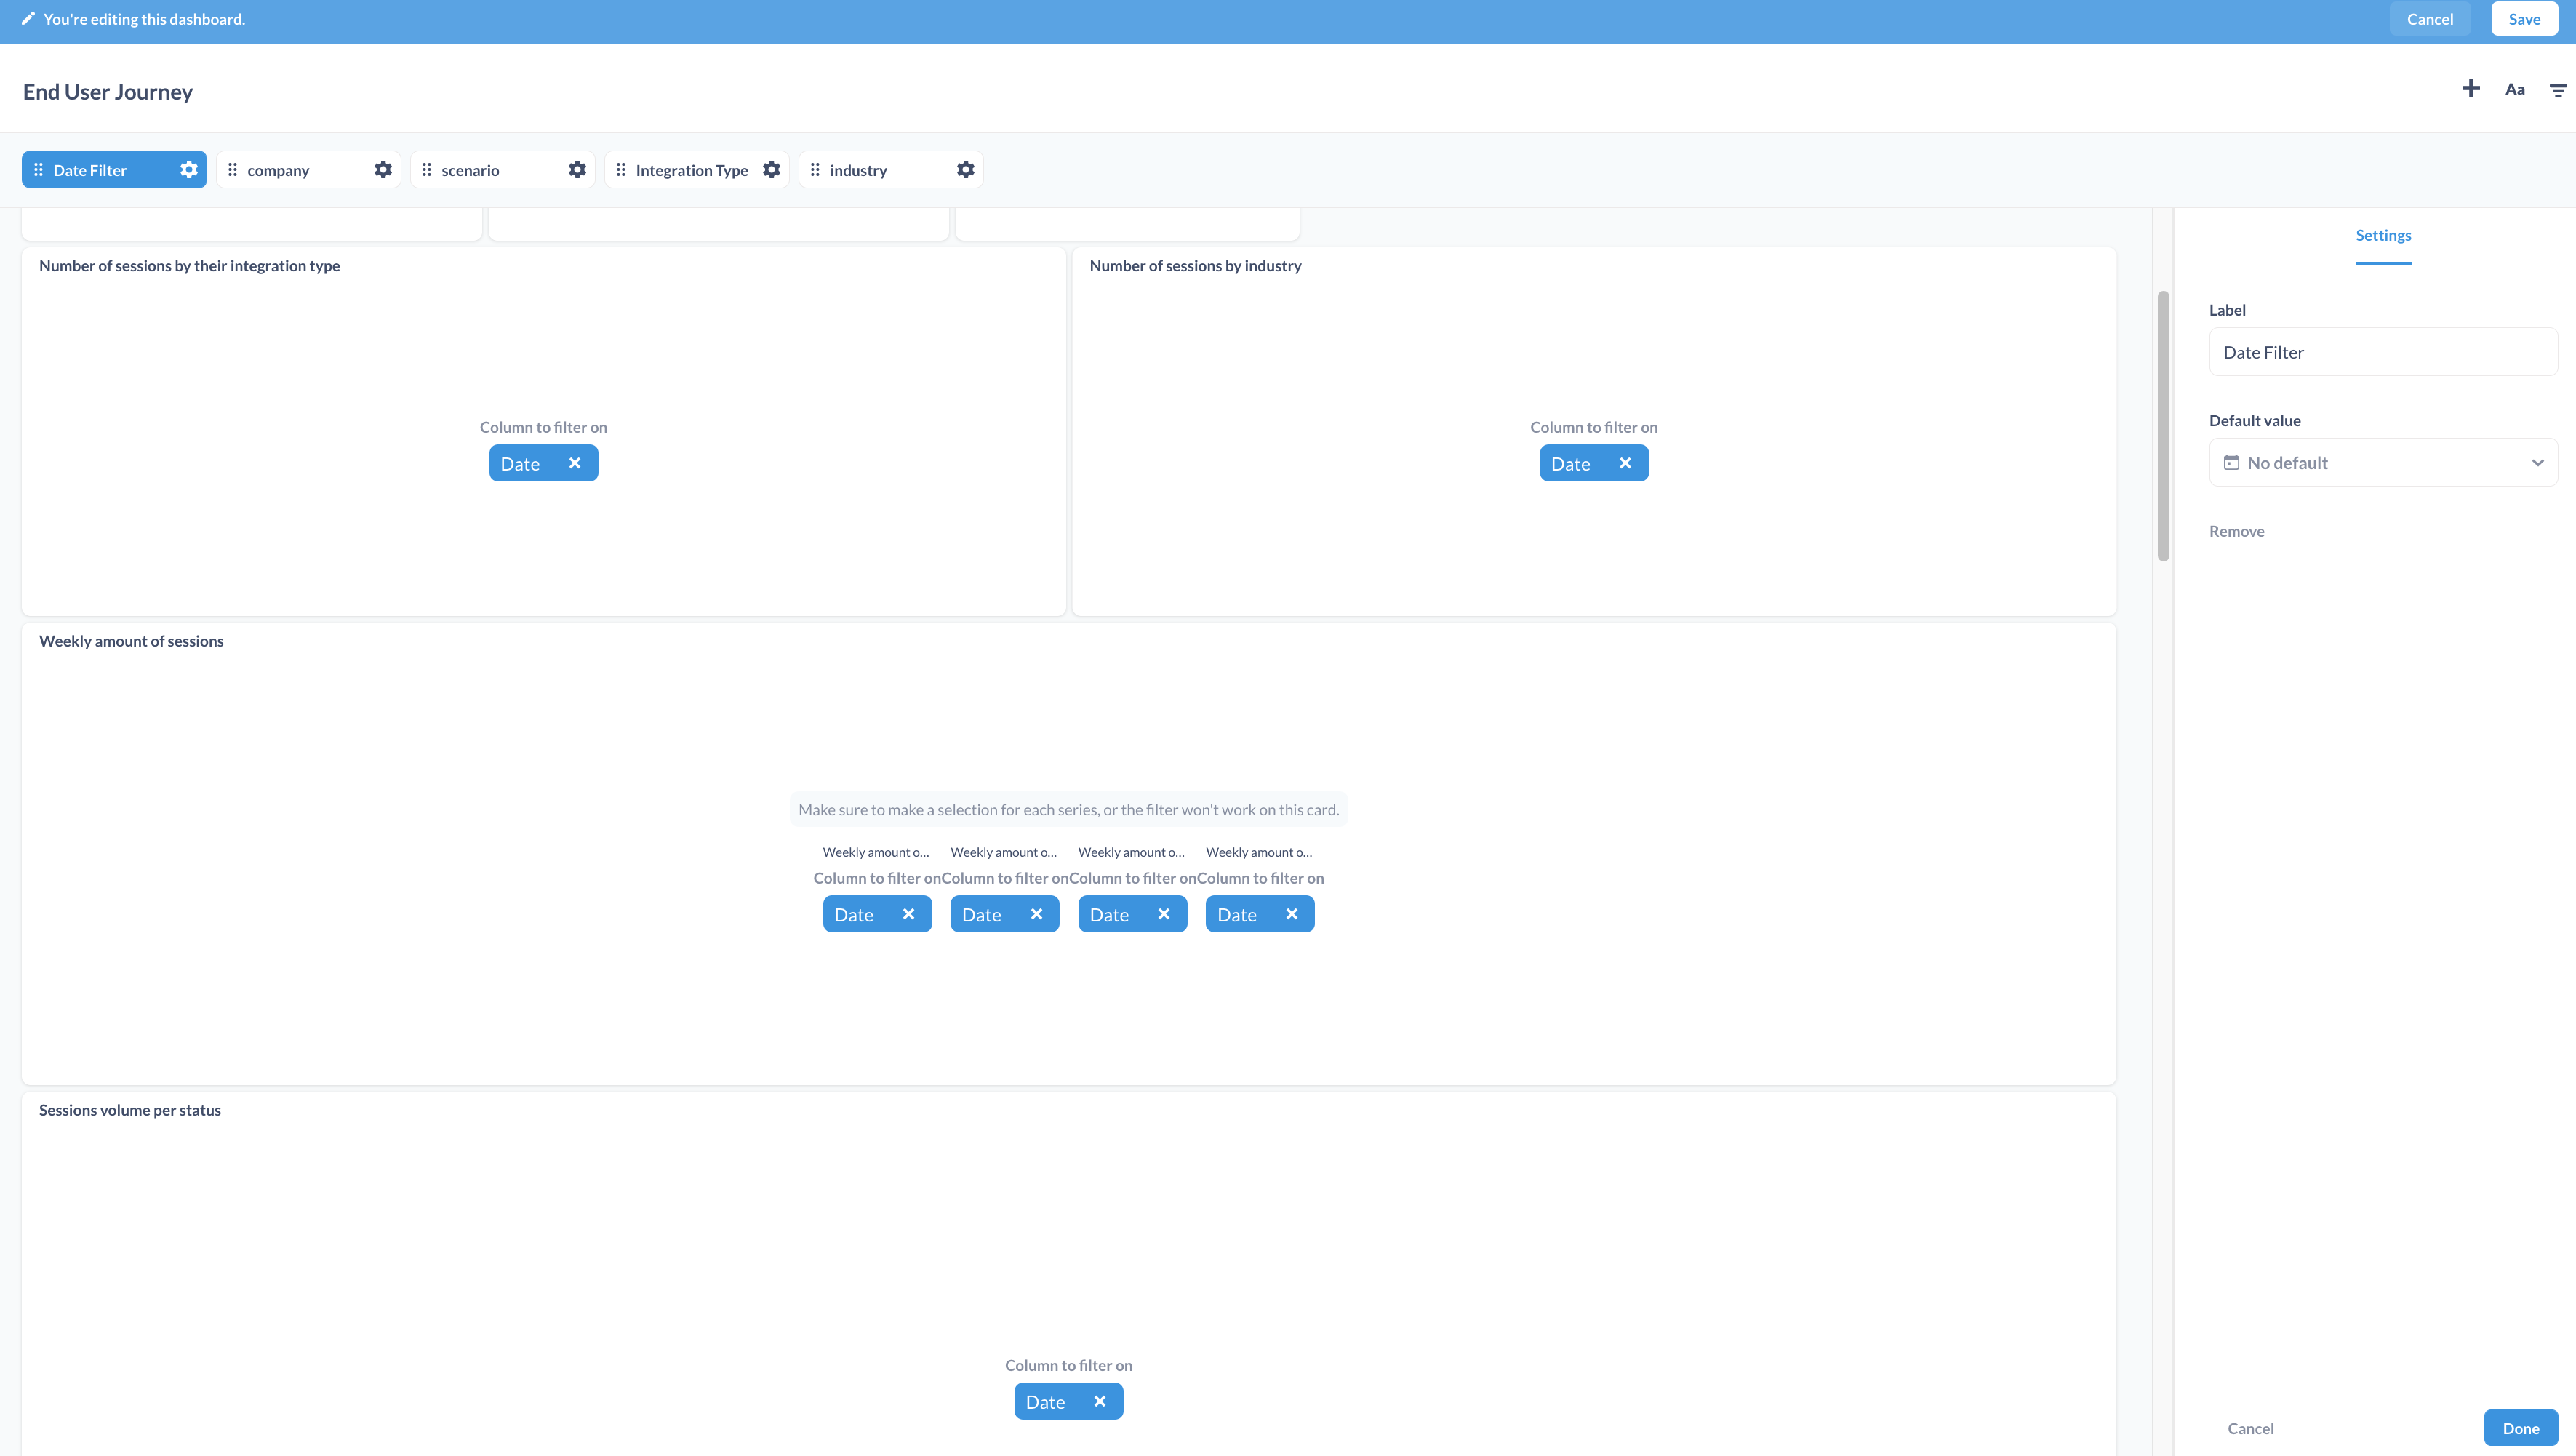
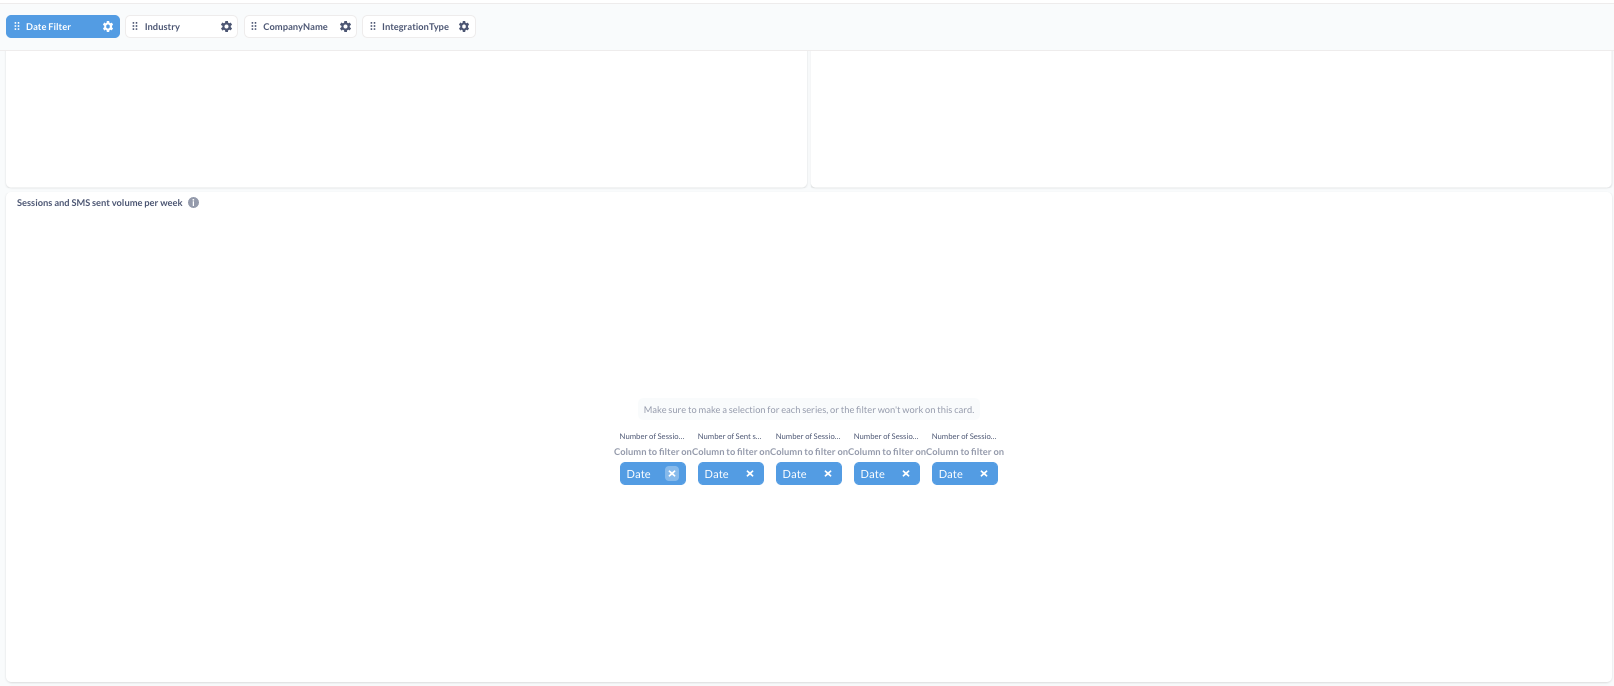
As you can see in the image below, all my questions are linked to the date filter.
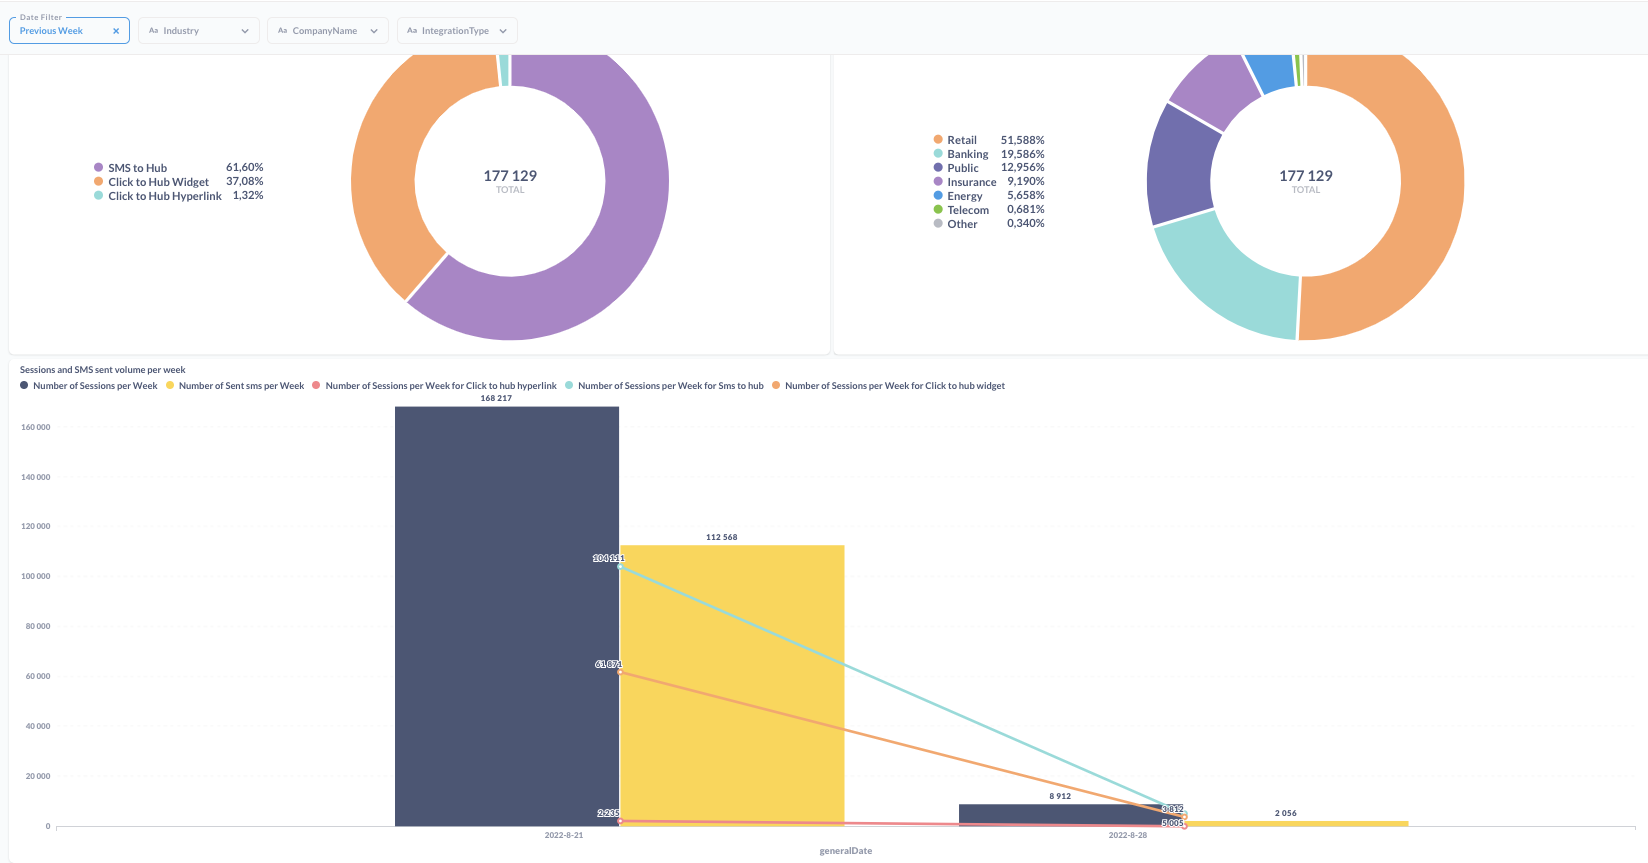
However, even if I try to display only the data from last week, I still get to see all of the data from April to now in the last graph whereas, all the other questions in the dashboard display the correct information.
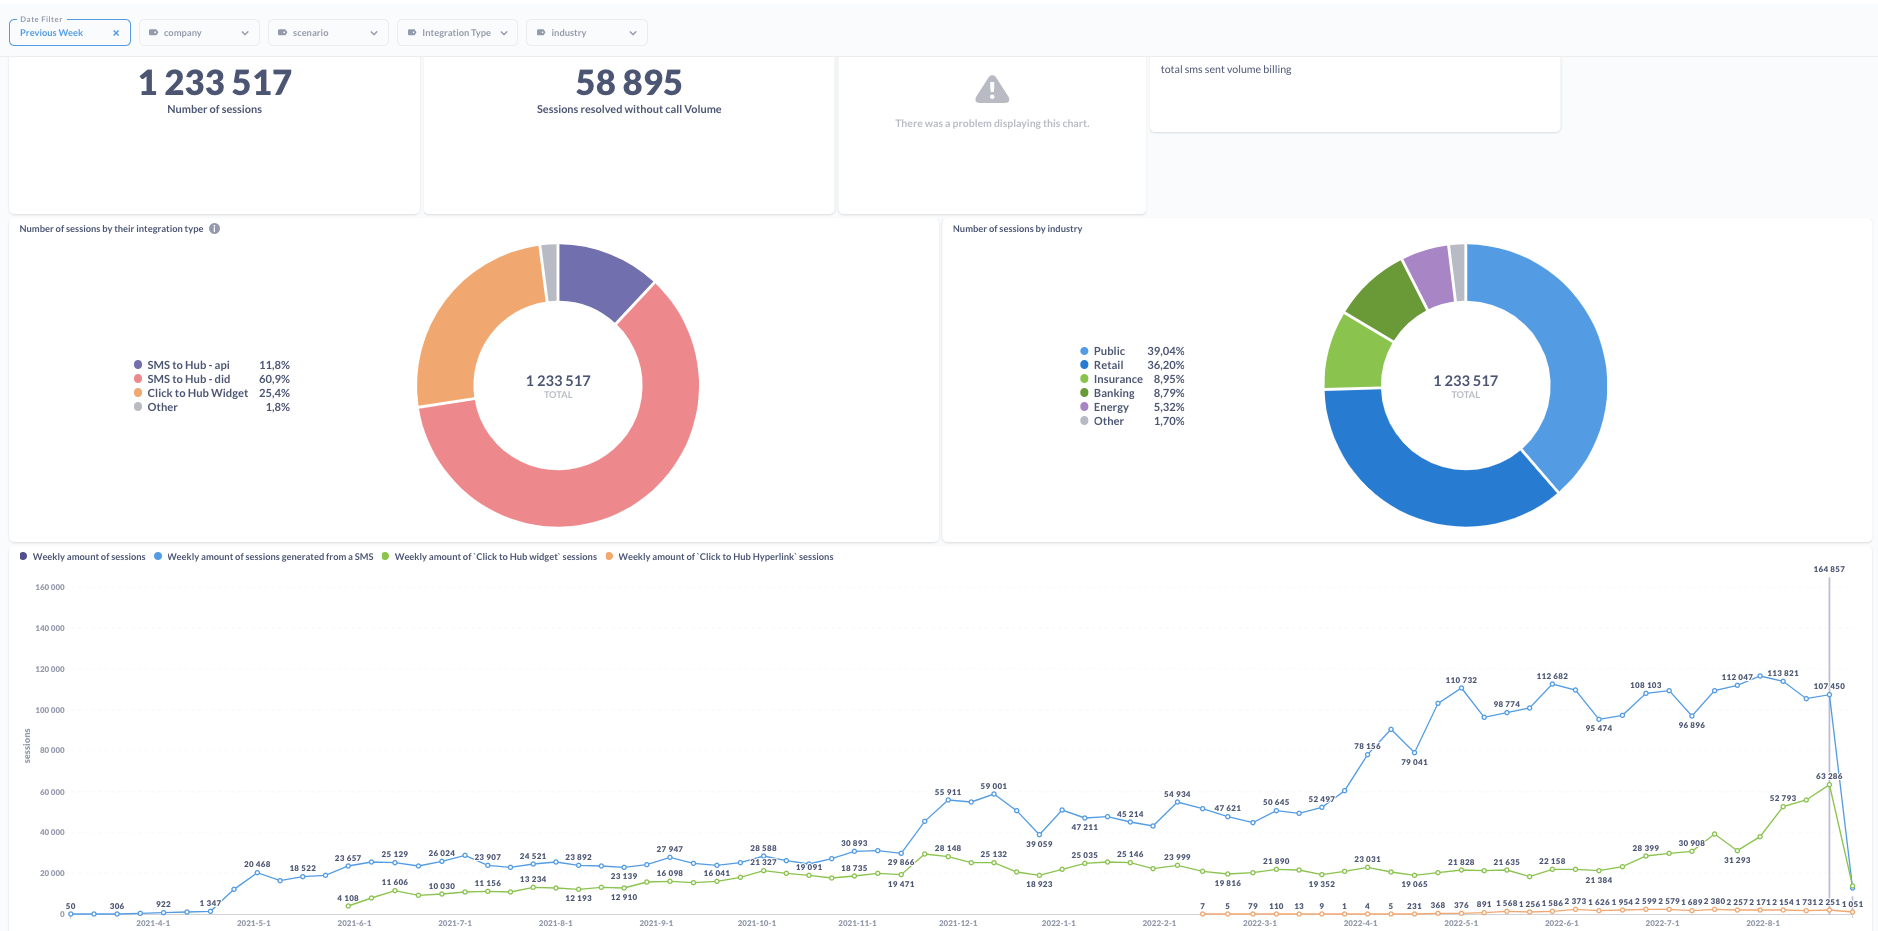
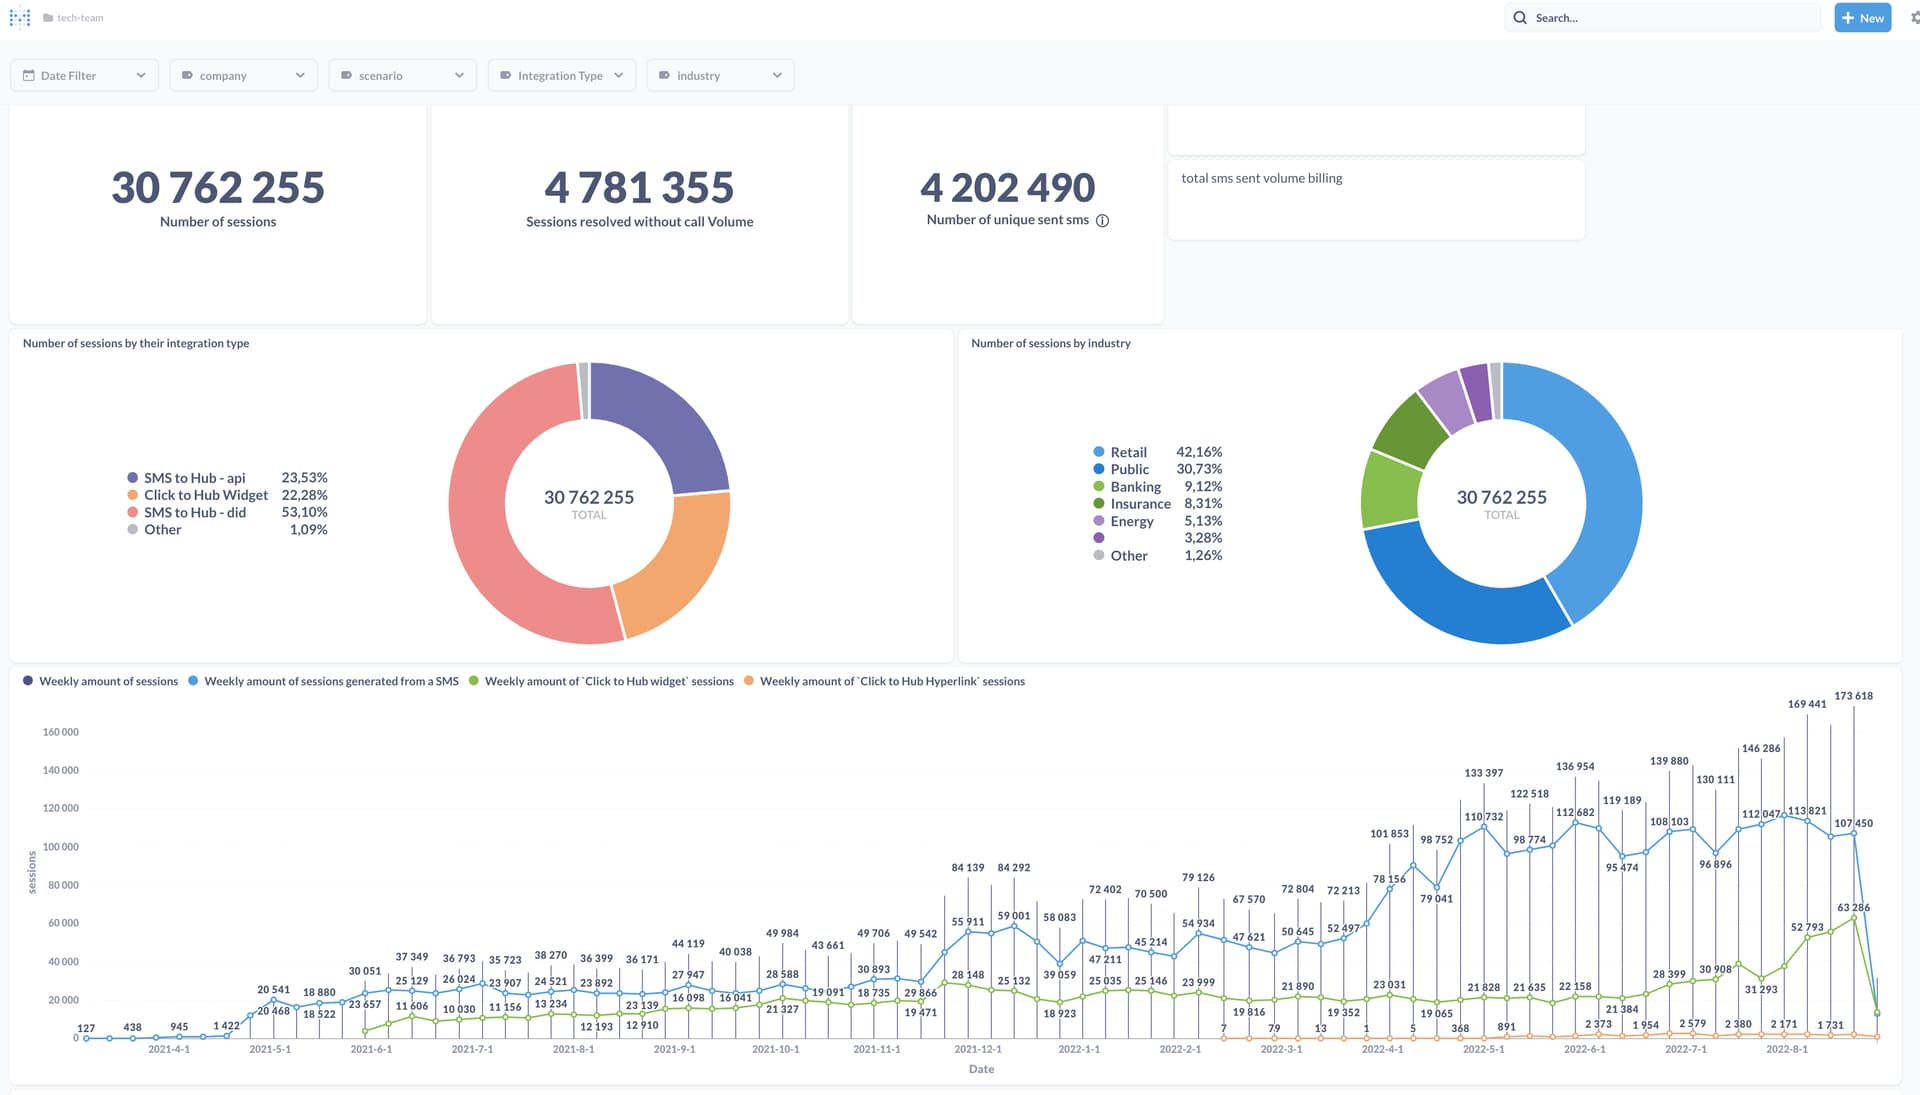
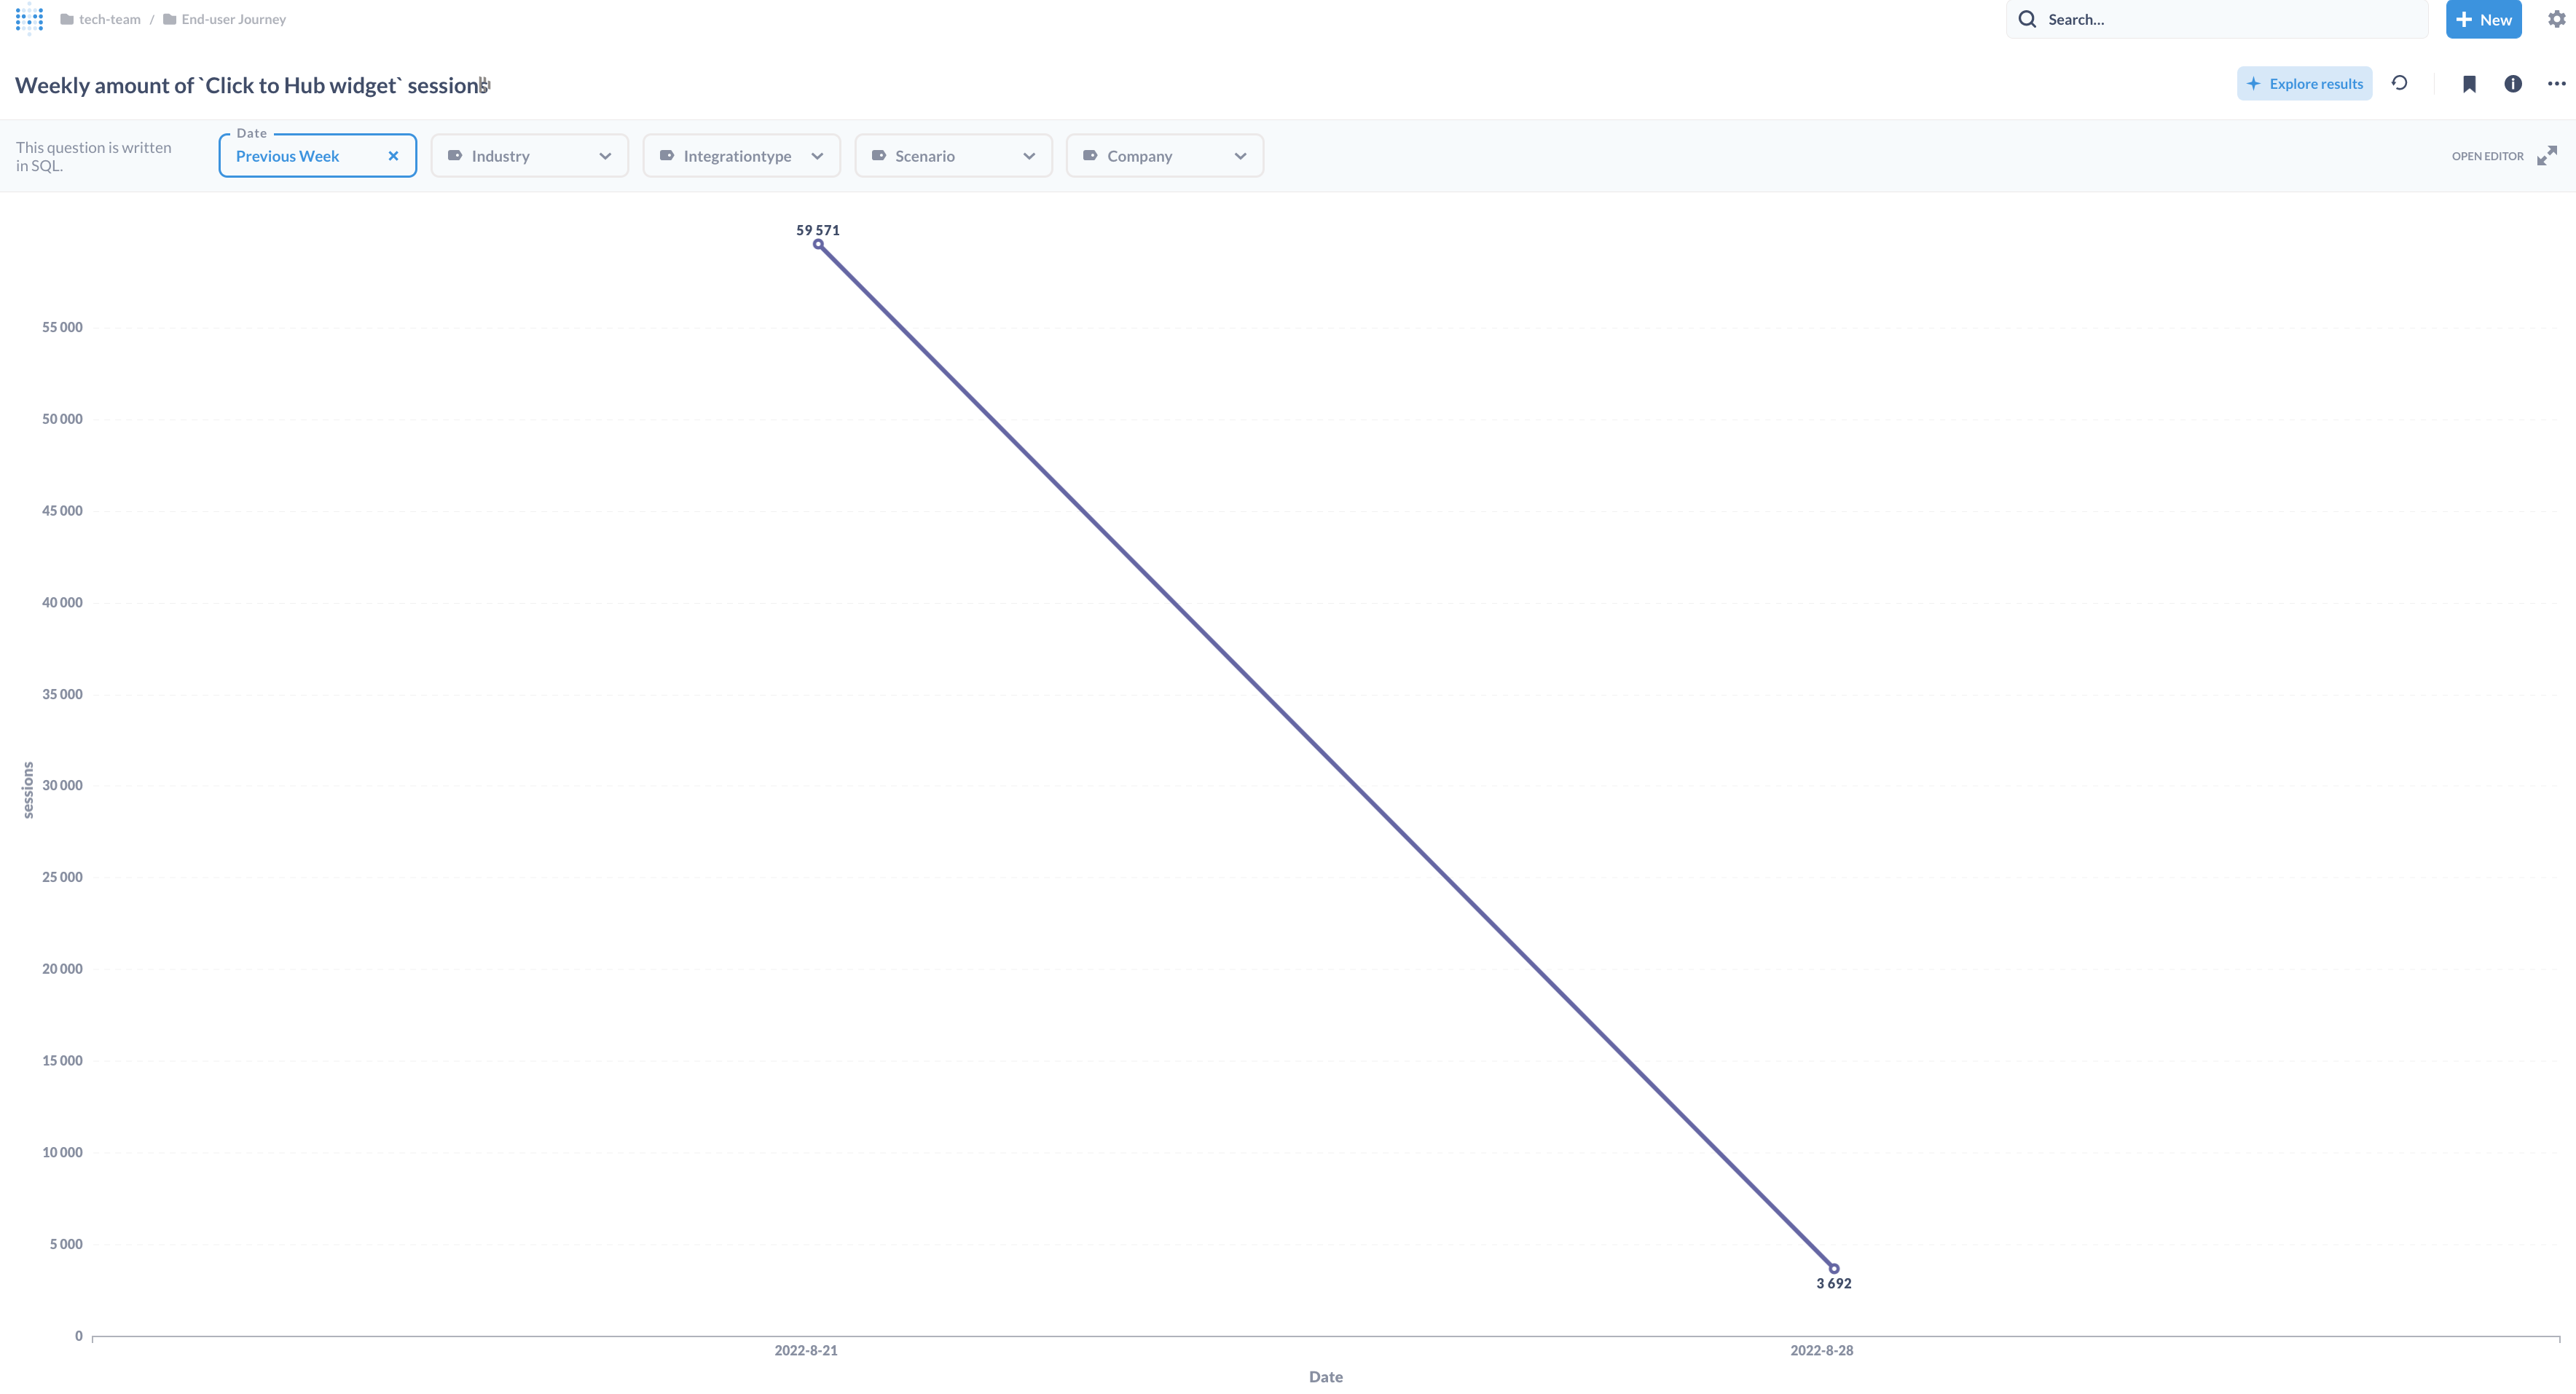
Side note, you can see however that the weekly amount of sessions does get filtered correctly on this graph, but it's the only one out of the four questions used in this graph. In fact, if I don't filter, you can see the difference for the weekly amount of sessions:
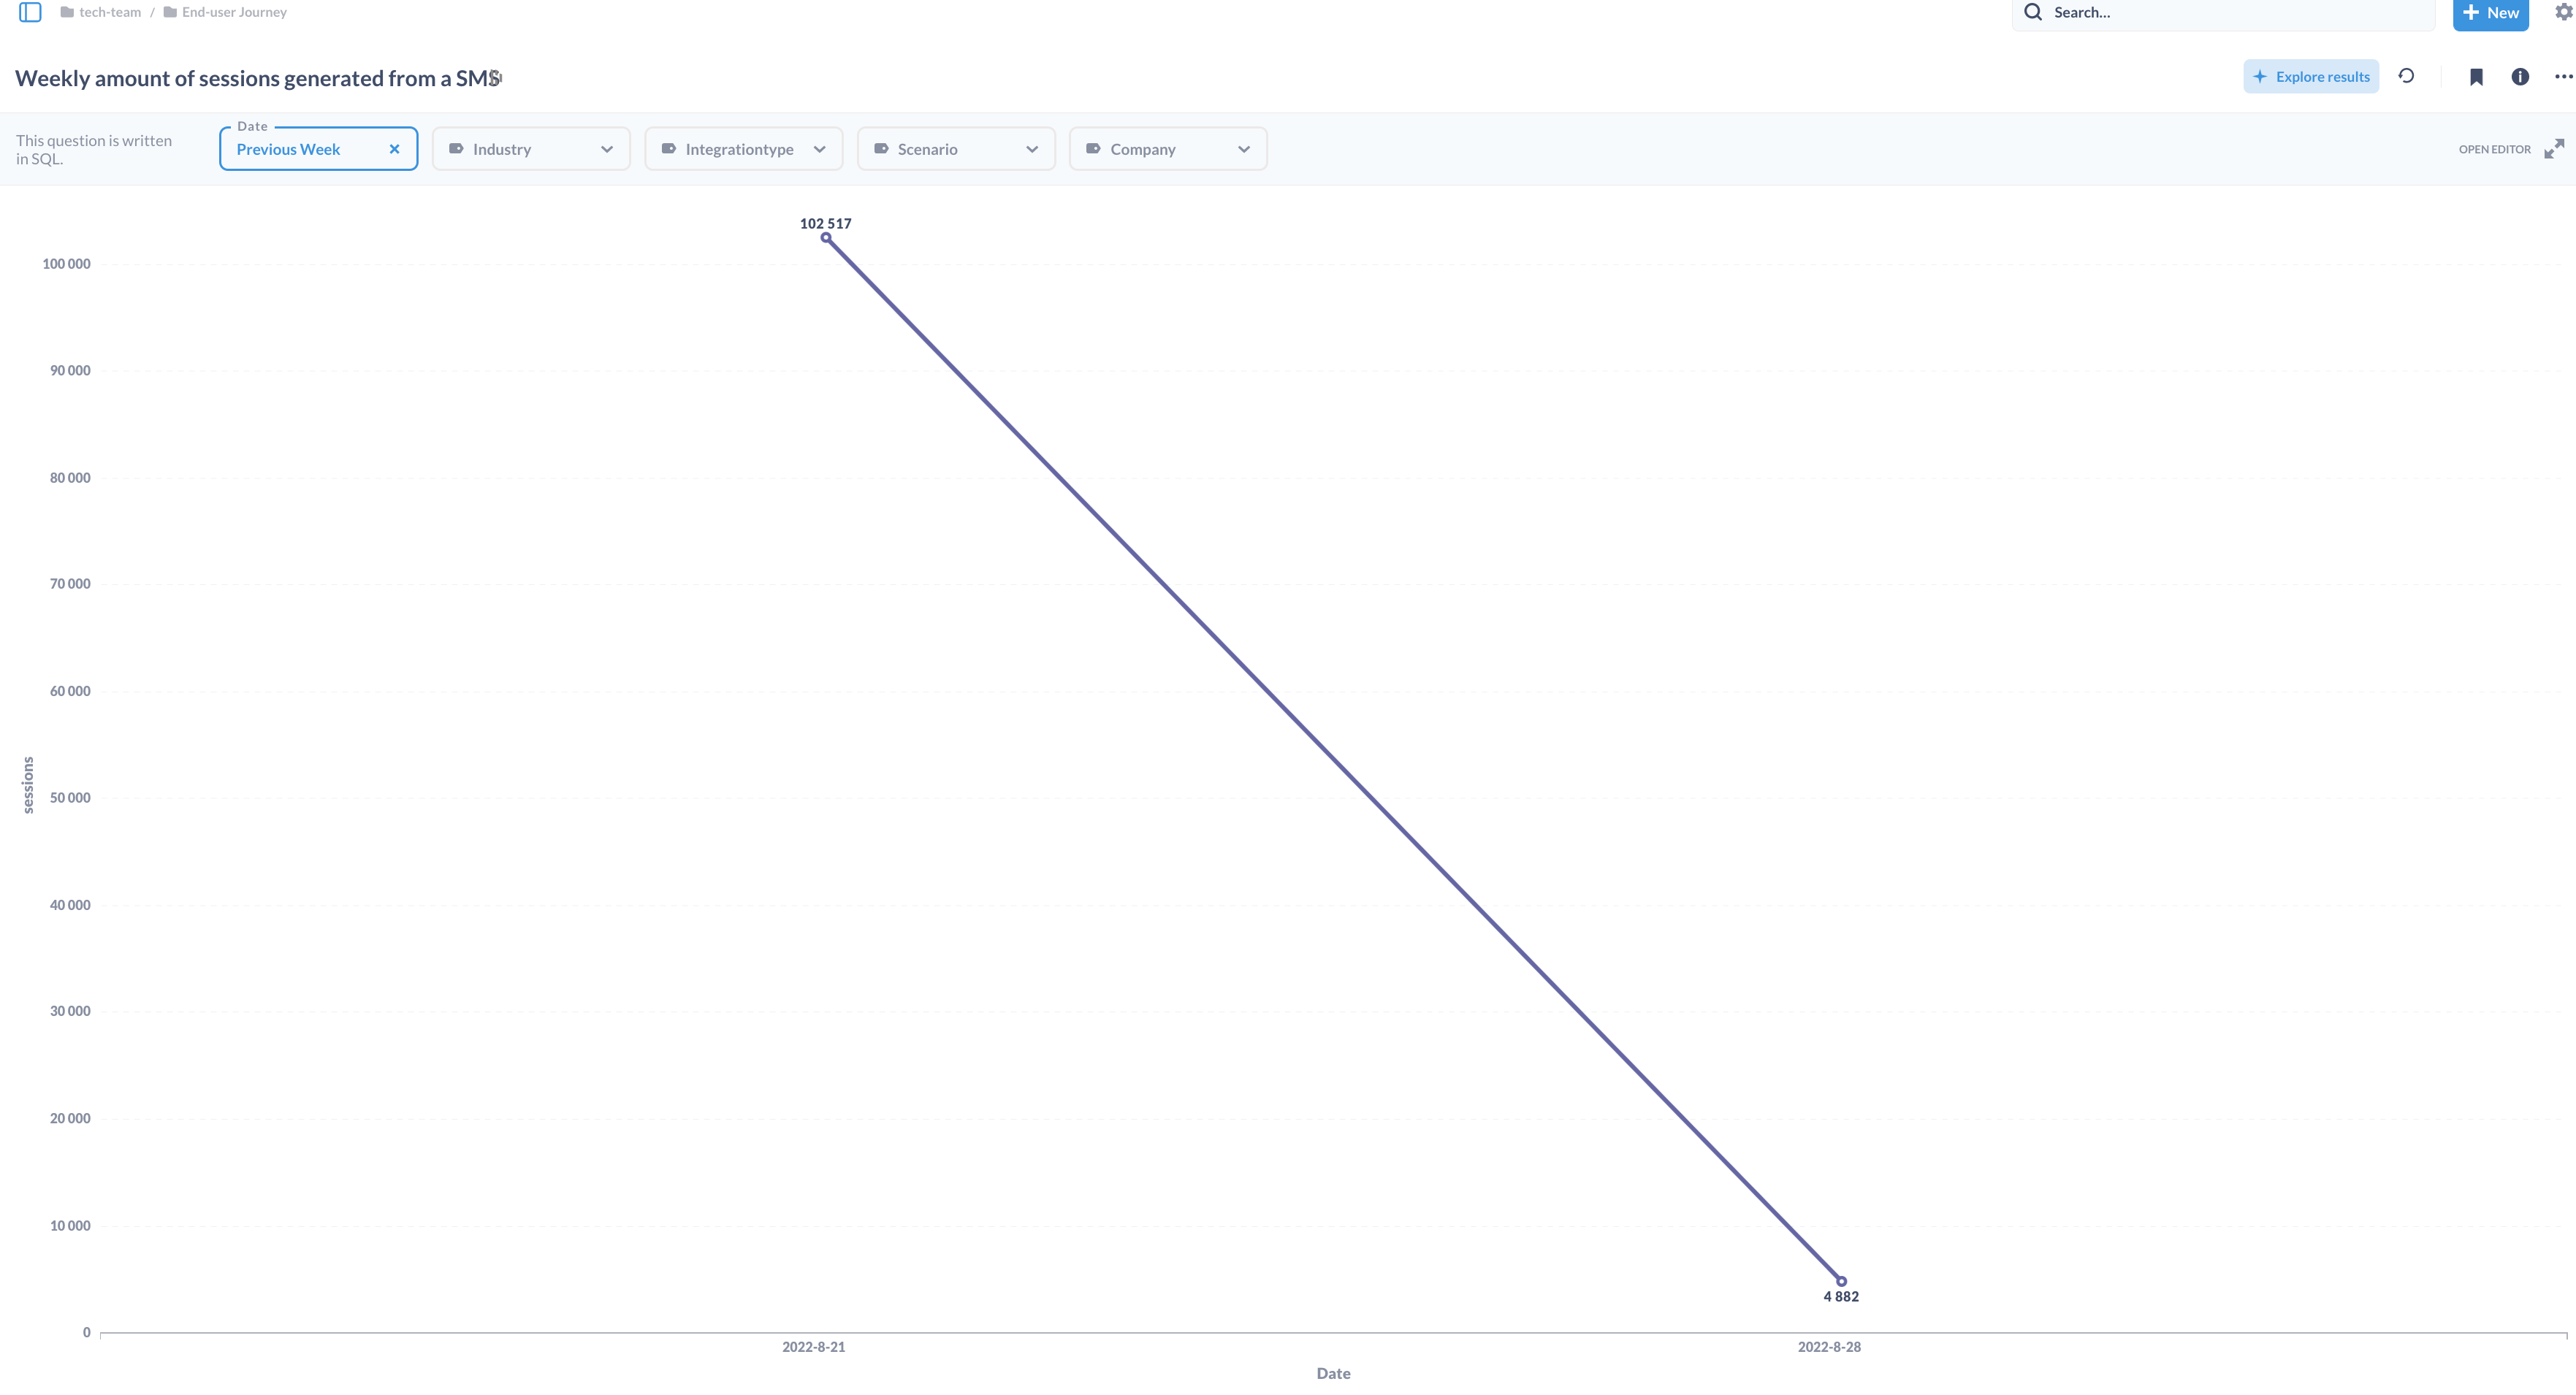
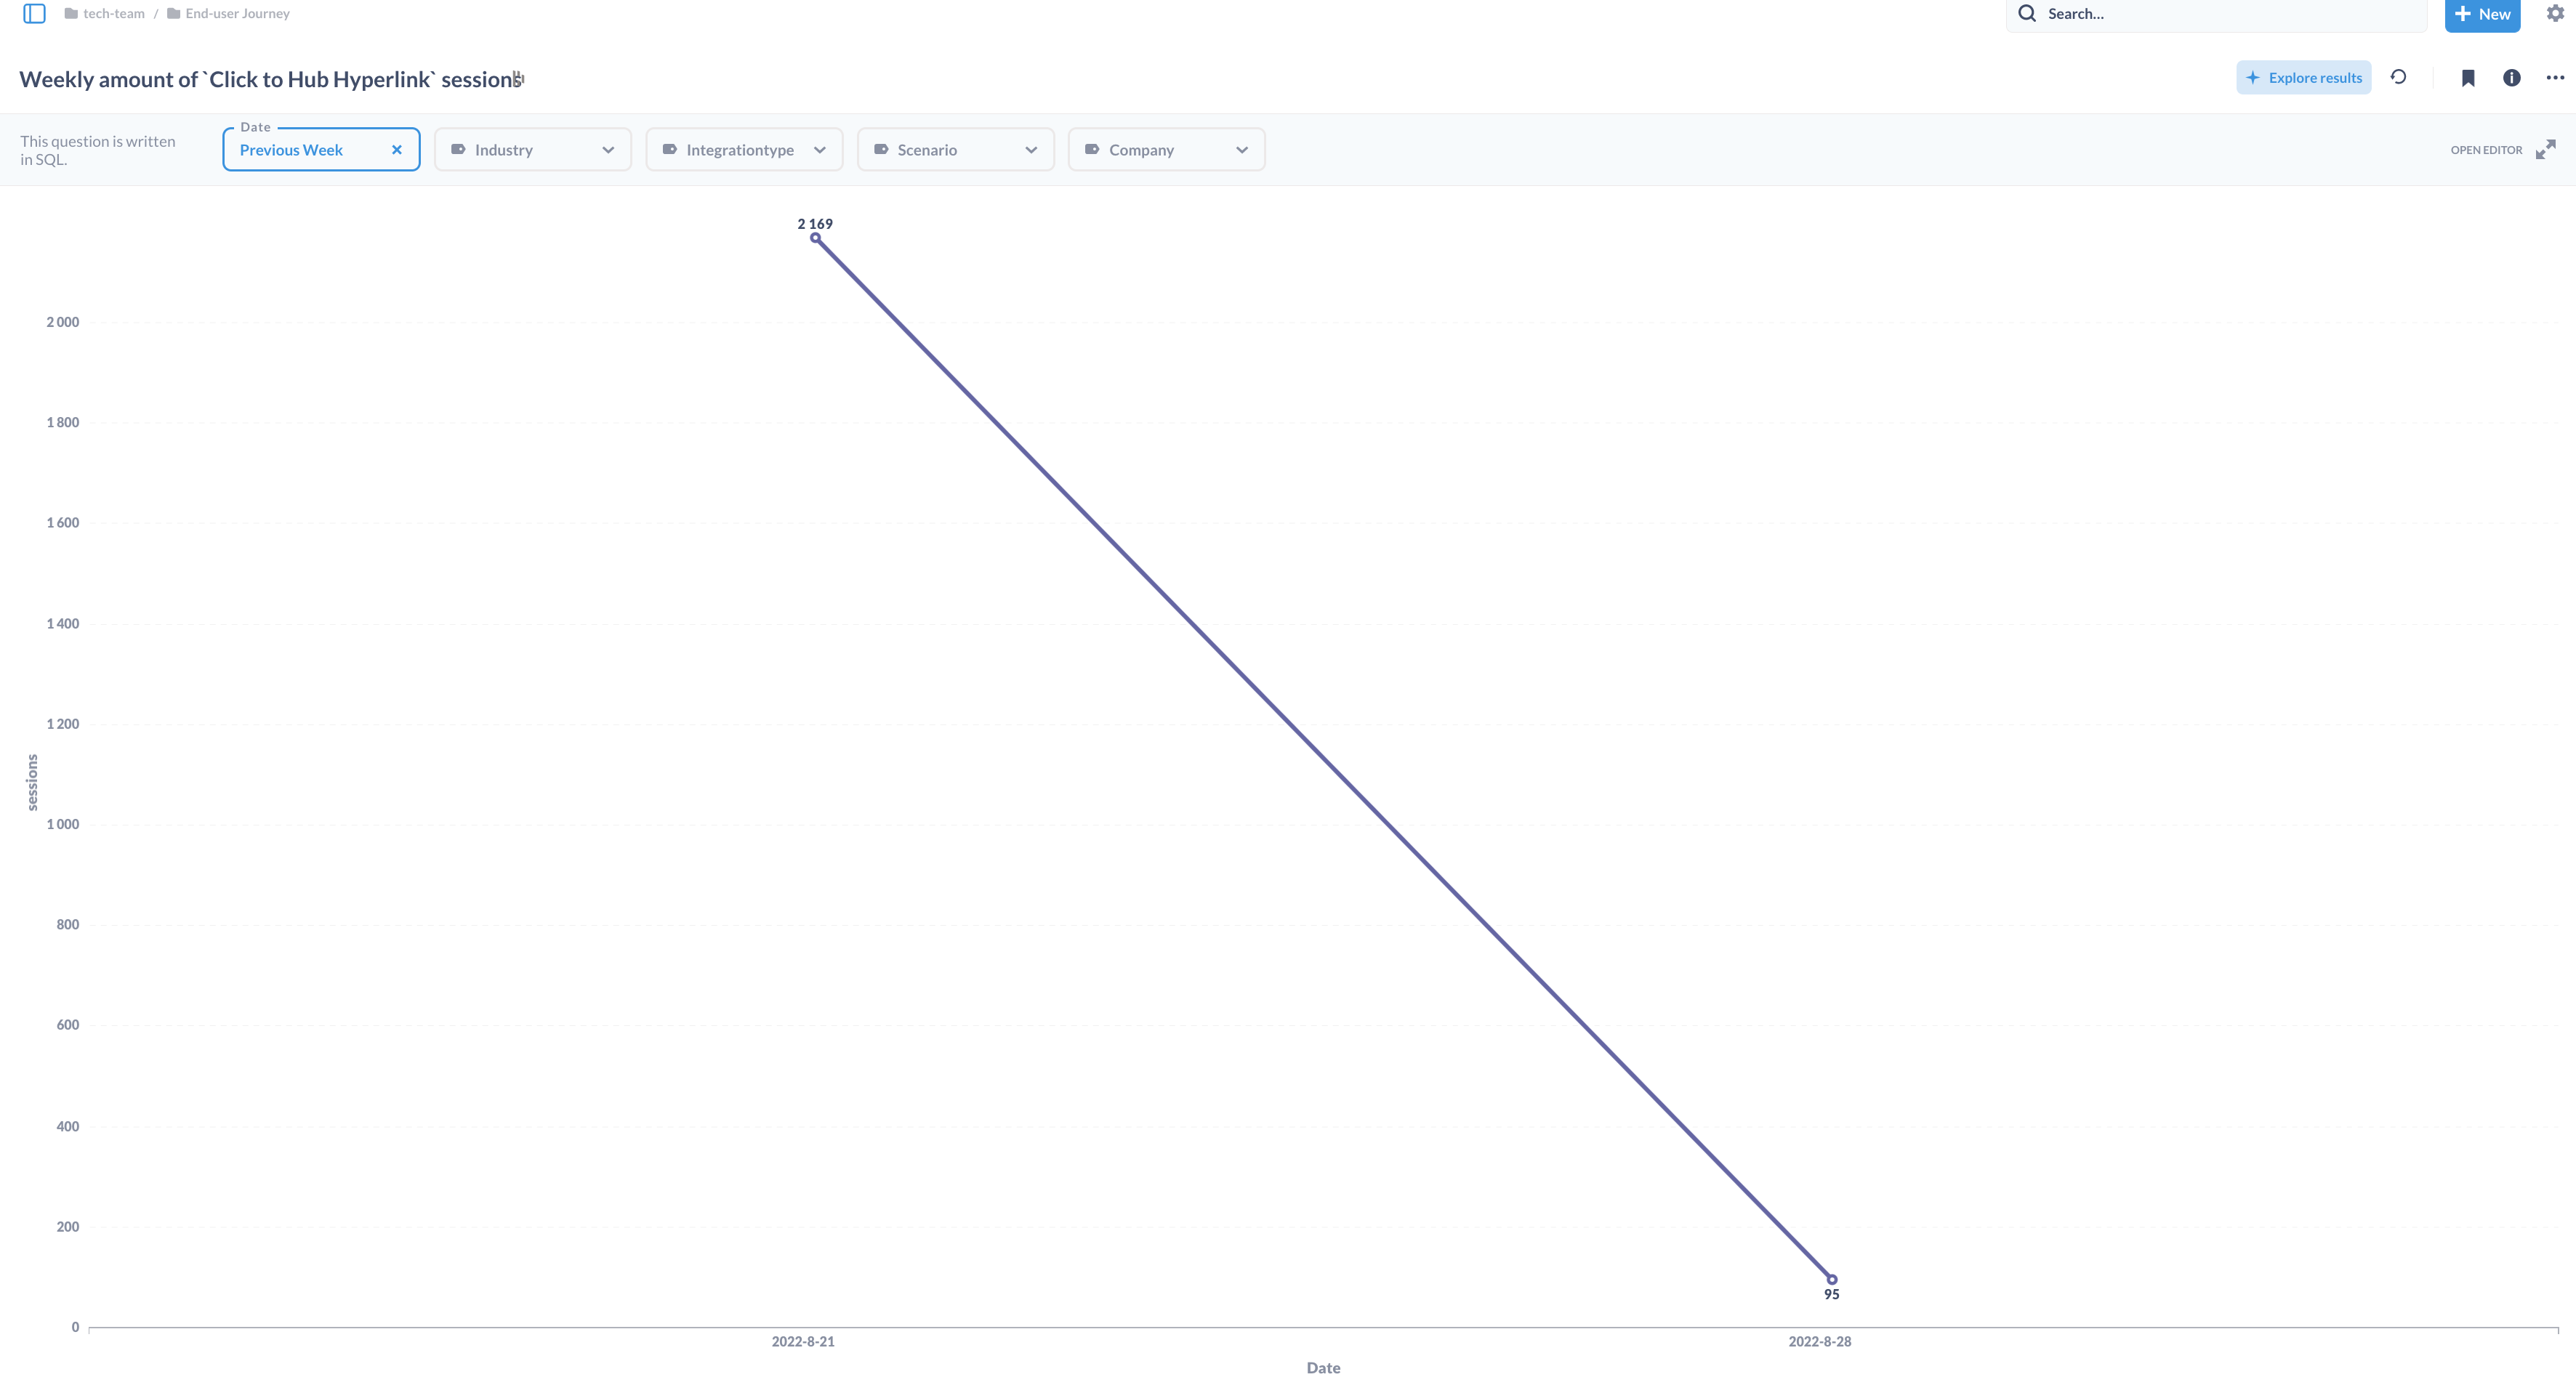
As you can see in those four other images below, when I click separately on each of this question, the data get displayed correctly (only the last week data shows up). Each of this question, use the same date field from the same table (sessionCreated field from the sessonFunnel_raw table).

How do I get to filter correctly with the date filter this multiple questions type of graph ?
Another thing to note, I have an older dashboard with the same configuration, and I have no problem getting to filter the information with the date filter. BUT, I can't get rid of the date filter even if I try to delete it.
Thanks for your help !
Audrey