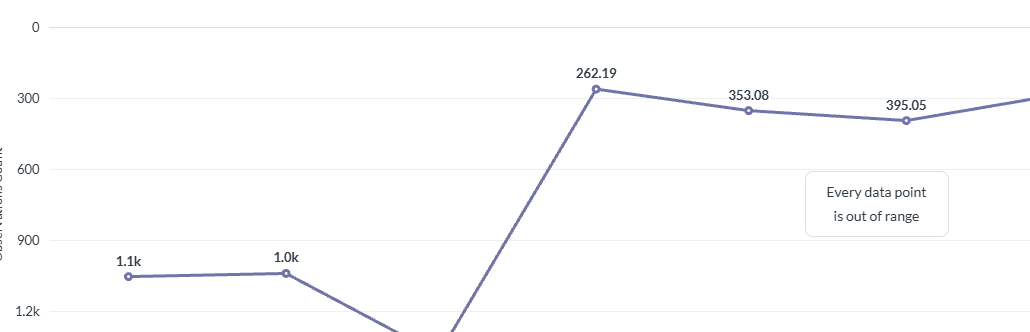
Slightly bizarre one. My customer wants the Y-Axis reversed (0 at the top, 1500 at the lowest). Reason being that they interpret a line going up as good and want consistency across multiple charts.
The UI will accept the 0 as the highest and 1500 as the lowest and displays correctly. However, there’s a box in the middle saying that ‘Every data point is out of range’:
Oh that’s cute, I wouldn’t have expected reversed Y axis limits to work.
Is this on a current Metabase version? There were changes recently to Y-axis ranges to force data to clip to specified limits, I wonder if the pop box was put there so people aren’t confused when their chart that used to display data now displays nothing.
The check probably looks for low>y>high and wouldn’t expect low > high …
It’s the latest release.
I’m just as surprised that it got this far without throwing an error.