Hi all,
I'm trying to use pulses however my charts are always converted to tables. I've noticed the issue Different chart rendered in pulse from question, but it seems my charts are simple enough.
Hi @ricardo.ekm
Correct, those charts are fairly simple and should not be forced as table for a pulse.
Which database are you querying?
And can you supply the data export of those questions, so I can try to reproduce this issue? Redact names where needed.
By the way, on linking to the correct (or likely the most common) issue in regards to pulses.
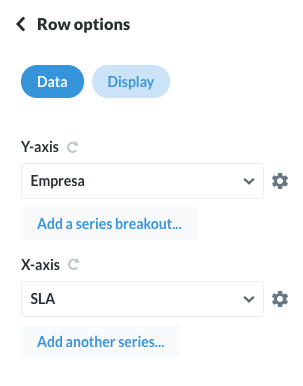
@ricardo.ekm Make sure you're only returning the columns as needed, then it works as expected.
So for the row chart, make sure it's only Empresa y SLA returned. It doesn't work if you try to hide the columns or only select some of it.
This actually feels like another issue, but I think the one you referenced covers all of it in general.
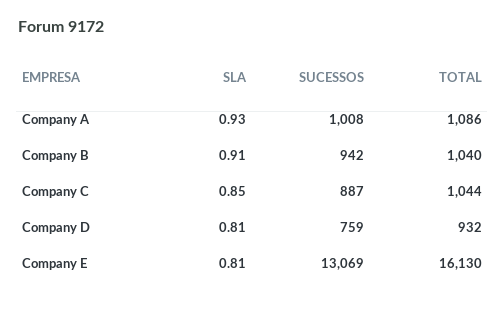
Here's returning all columns and displaying as a row chart, the the pulse looks like this:
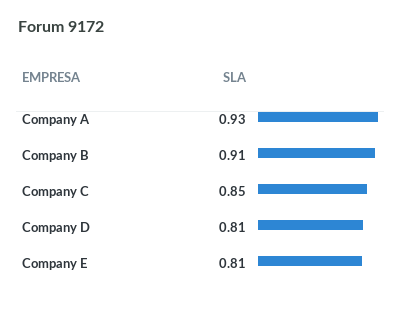
And when only returning the needed columns, then the pulse looks like this:

 on linking to the correct (or likely the most common) issue in regards to pulses.