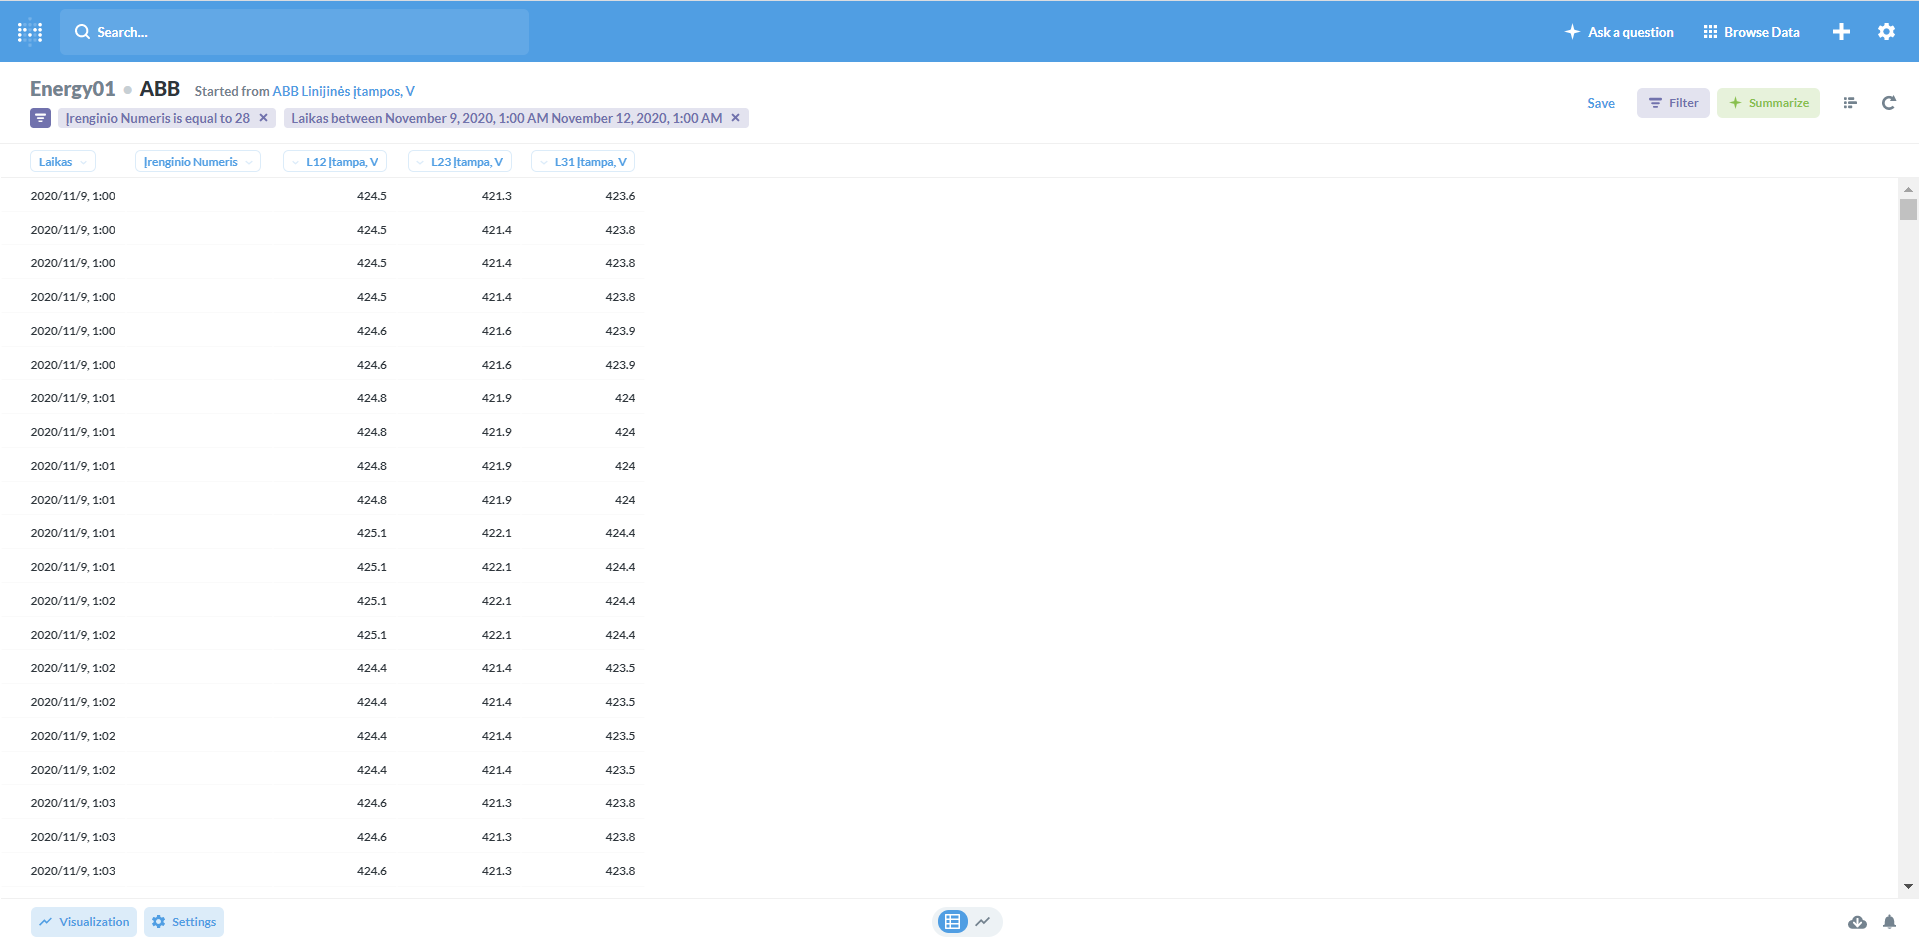
Hey, I've been having trouble with too much data that I need to graph. Is there any way I can filter my time values, like using using every 3rd row or even higher number of rows in between? f.e. I have a data values every few miliseconds but I need to display fewer values:
**|Laikas|Įrenginio Numeris|L12 Įtampa, V|**
** |---|---|---|**
** |2020-11-08T23:00:06.18Z|28.0|424.5|**
** |2020-11-08T23:00:16.2Z|28.0|424.5|**
** |2020-11-08T23:00:26.23Z|28.0|424.5|**
** |2020-11-08T23:00:36.24Z|28.0|424.5|**
** |2020-11-08T23:00:46.27Z|28.0|424.6|**
** |2020-11-08T23:00:56.29Z|28.0|424.6|**
** |2020-11-08T23:01:06.31Z|28.0|424.8|**
If i select a time period between more than 1 day, it just shows me the filters first day, because I guess - It's that much data...
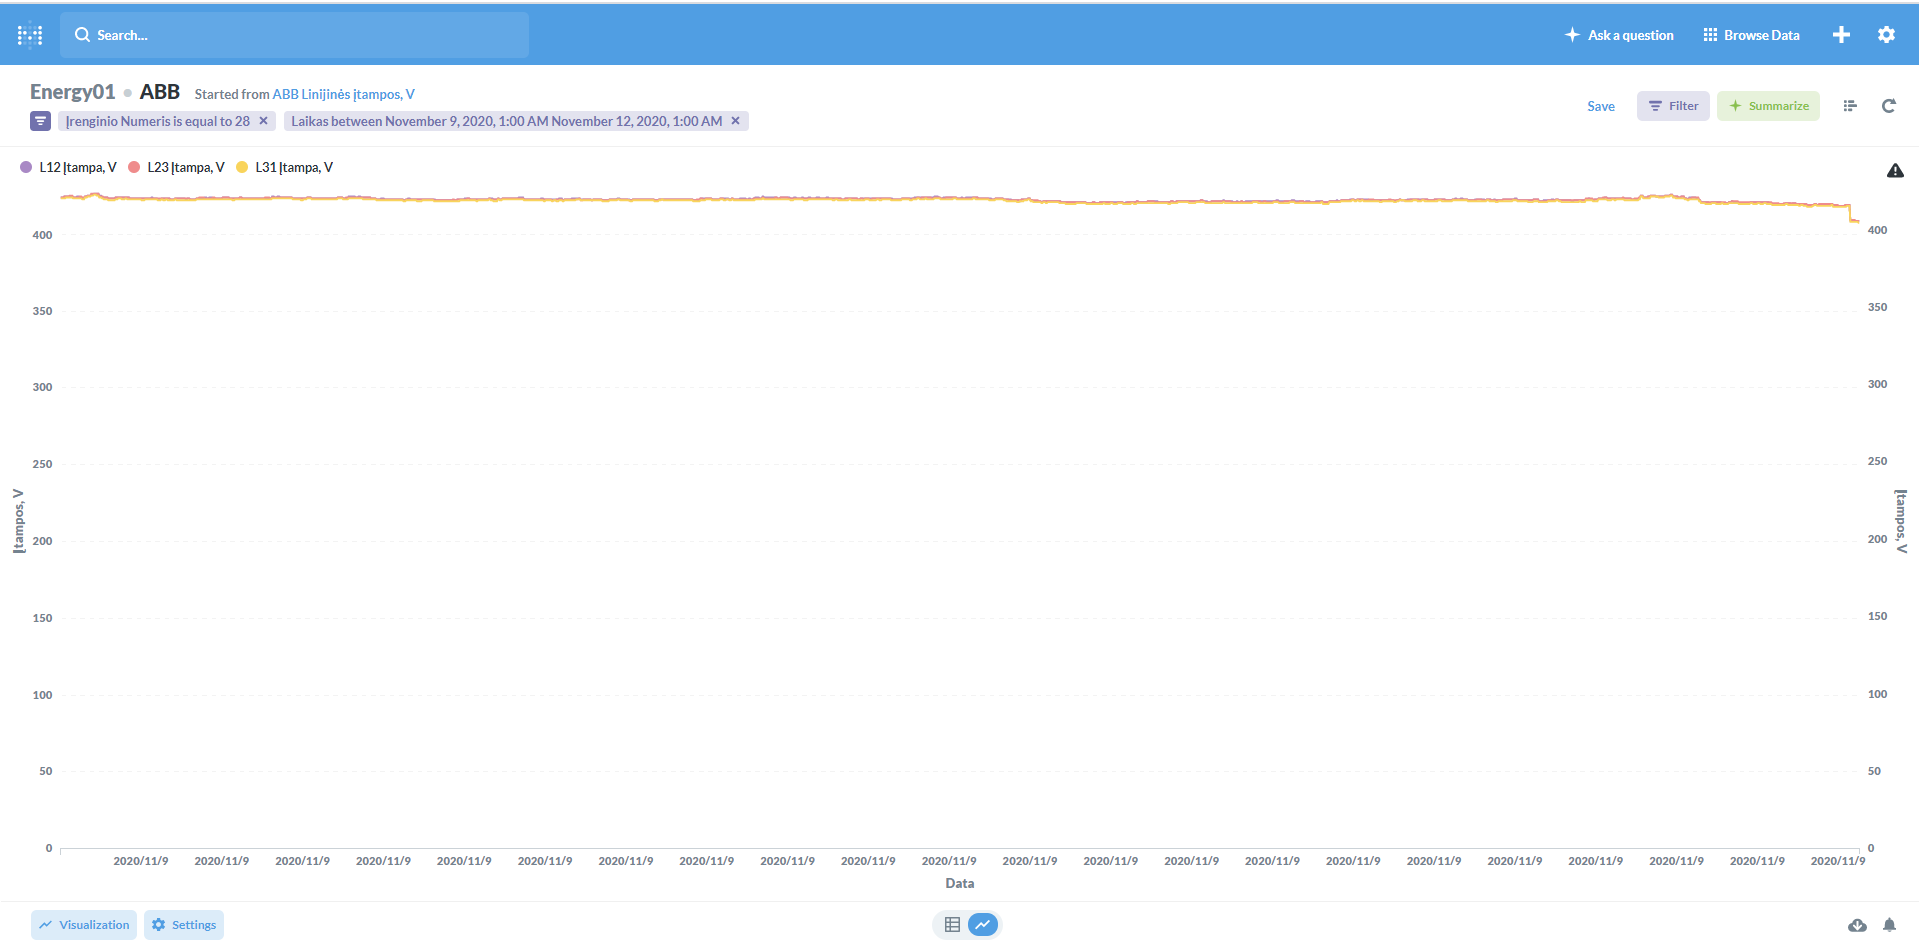
the graph is already truncated to 2000 rows because it's trying to lower the row number but I guess it isn't enough.