Hi, i've been stuck in this situation for a couple of days, and can't figure out how to solve this region map problem
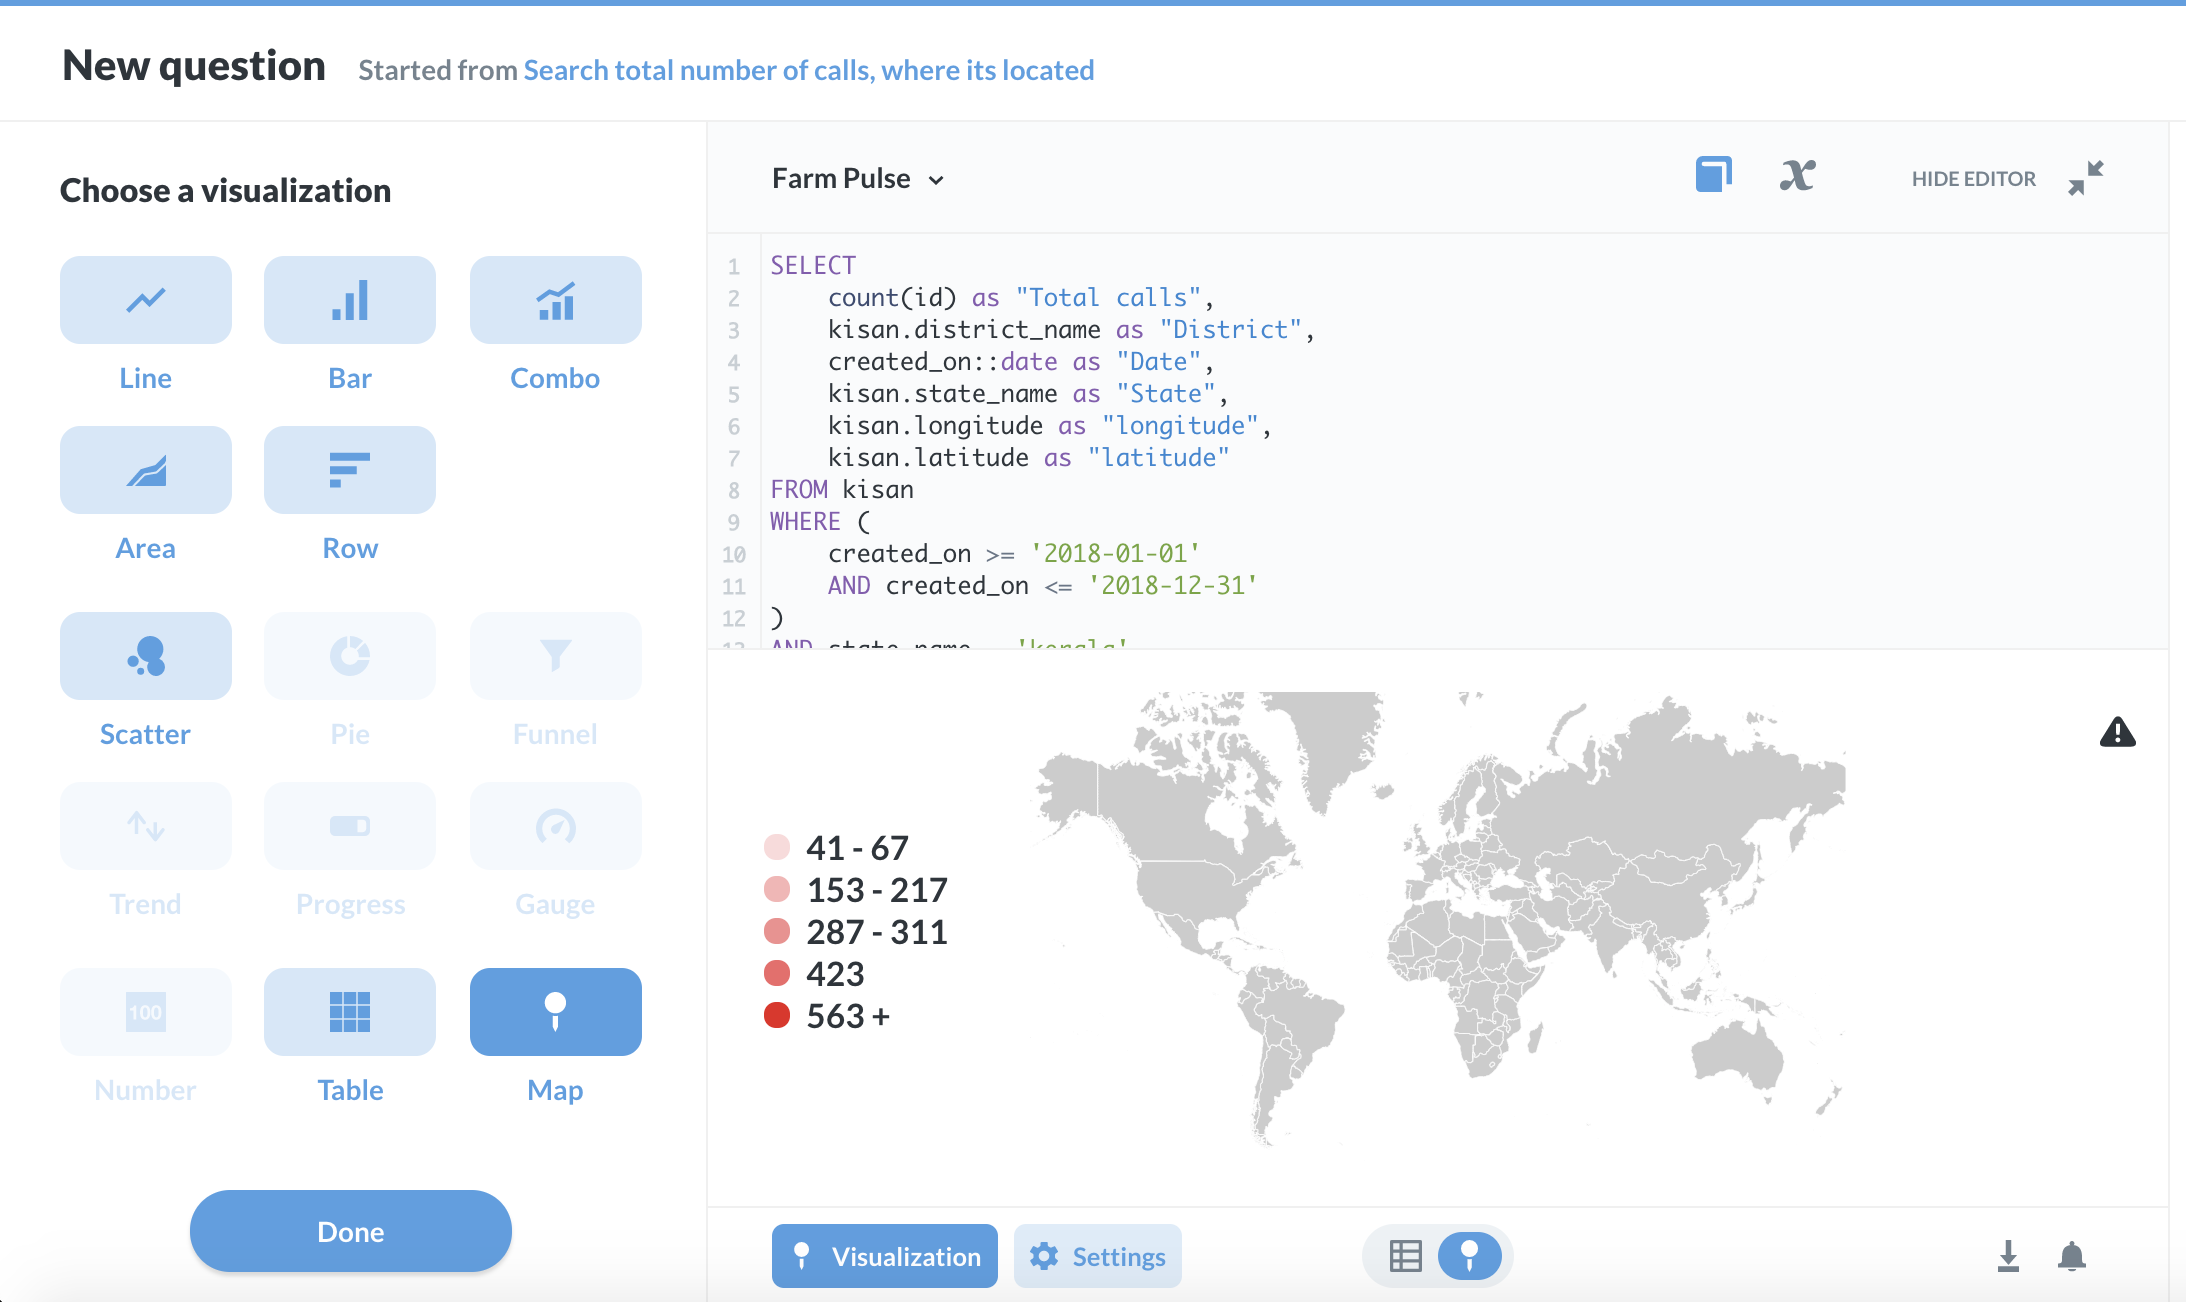
I wanted to show the total calls for every district and map it in region map, the one with most calls will have more darker color
This is my sql code
SELECT
count(id) as "Total calls",
kisan.district_name as "District",
created_on::date as "Date",
kisan.state_name as "State",
kisan.longitude as "longitude",
kisan.latitude as "latitude"
FROM kisan
WHERE (
created_on >= '2018-01-01'
AND created_on <= '2018-12-31'
)
AND state_name = 'kerala'
group by created_on, state_name, district_name, longitude, latitude
Hi @NeedHelp
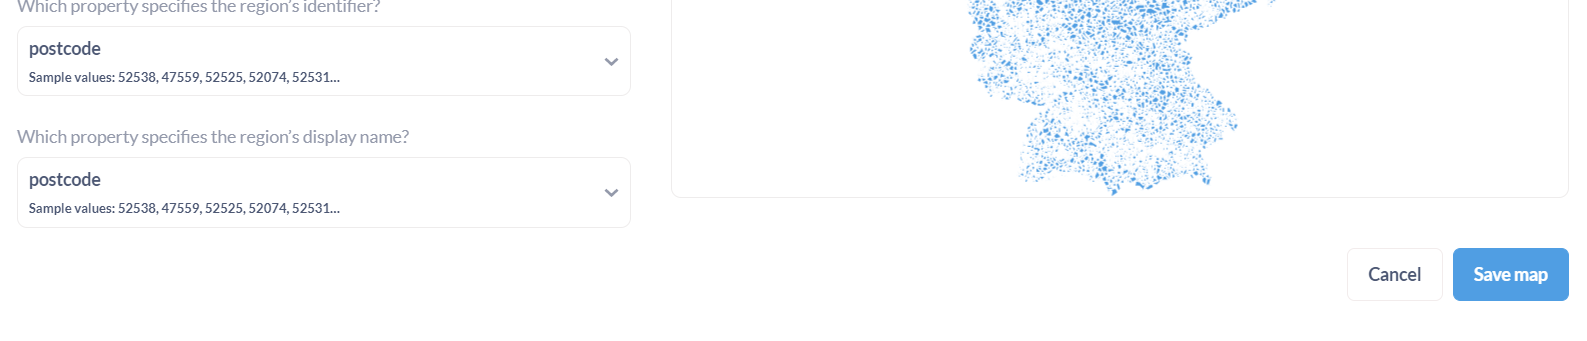
You need to specify the region identifier, when adding the map under Admin. And then your data needs to use the same identifier, which you connect in Visualization Settings.
So your data needs to have the same district names as available in the GeoJSON.
Hi @Laura.dropp
Post the URL to your GeoJSON map, so it can be reproduced.
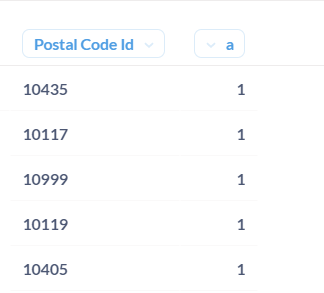
Is the region identifier numeric or string based? Your SQL seems to return a string.
Show the visualization settings sidebar, so it is possible to see how you are mapping the fields.