In past versions Metabase displayed the values on a row chart. I just realized that metabase no longer showing me the values when im using a sql based question.
Do i miss something or is this a bug. Couldnt find a topic about that.
thank you
heldino
Hi @heldino
Post "Diagnostic Info" from Admin > Troubleshooting.
Which version is "past versions" compared to which version?
A screenshot of the problem would be helpful.
I have to correct myself. It does not work in general.
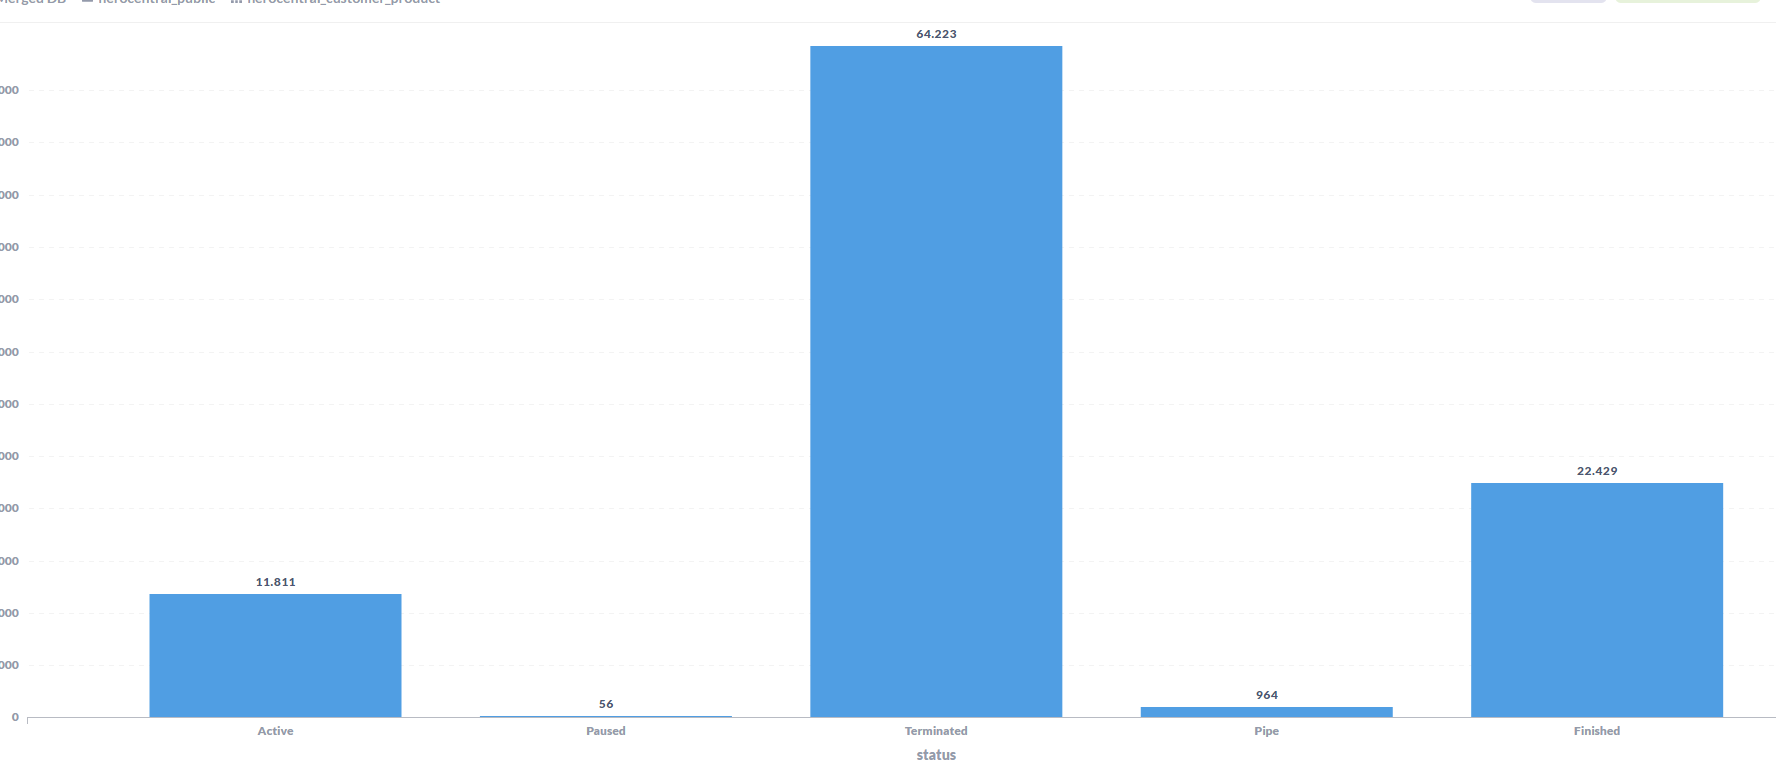
First picture (Bar chart ) shows me the values.
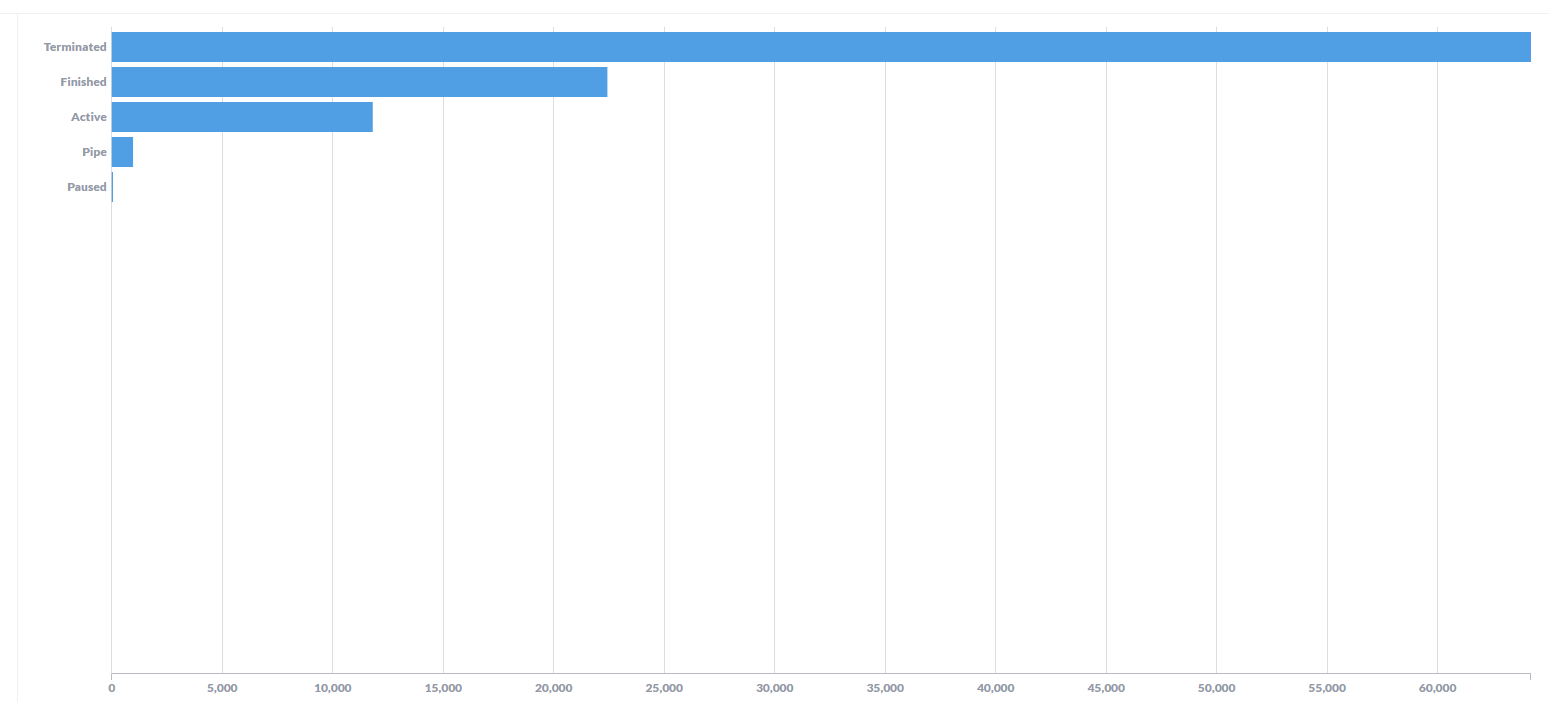
If i use a Row chart (Picture 2), Metabase do not display any values.
I cant really say in which version it worked. Should be < 0.36
Diagnostic:
{
"browser-info": {
"language": "de-DE",
"platform": "Win32",
"userAgent": "Mozilla/5.0 (Windows NT 10.0; Win64; x64) AppleWebKit/537.36 (KHTML, like Gecko) Chrome/89.0.4389.128 Safari/537.36",
"vendor": "Google Inc."
},
"system-info": {
"file.encoding": "UTF-8",
"java.runtime.name": "OpenJDK Runtime Environment",
"java.runtime.version": "11.0.10+9",
"java.vendor": "AdoptOpenJDK",
"java.vendor.url": "https://adoptopenjdk.net/",
"java.version": "11.0.10",
"java.vm.name": "OpenJDK 64-Bit Server VM",
"java.vm.version": "11.0.10+9",
"os.name": "Linux",
"os.version": "5.4.0-70-generic",
"user.language": "en",
"user.timezone": "Europe/Berlin"
},
"metabase-info": {
"databases": [
"mysql",
"postgres"
],
"hosting-env": "unknown",
"application-database": "postgres",
"application-database-details": {
"database": {
"name": "PostgreSQL",
"version": "9.6.20"
},
"jdbc-driver": {
"name": "PostgreSQL JDBC Driver",
"version": "42.2.18"
}
},
"run-mode": "prod",
"version": {
"date": "2021-03-17",
"tag": "v0.38.2",
"branch": "release-x.38.x",
"hash": "91f0ed6"
},
"settings": {
"report-timezone": "Europe/Berlin"
}
}
}
@heldino You are referring to data point values, which was added in 0.34.0, but only for Line/Bar/Area. It has never been available for Row (or Scatter, or Pie, and probably others too).
Row chart is a very different code than the other visualizations, so that's why.
There's an issue open for essentially unifying the visualization with Bar, but just rotated, so it should get the same functionality (more or less):
https://github.com/metabase/metabase/issues/10967 - upvote by clicking  on the first post