I have two series in my query and I’d like to be able to plot them on separate Y axes (but on the same chart). Is this possible?
1 Like
Is this a GUI query or SQL?
Currently we allow multiple series ala http://www.metabase.com/docs/v0.16.1/users-guide/09-multi-series-charting.html
I have both. I’m able to get multiple series on the chart without problems, but one has values that are several orders of magnitude higher than the other, so I’d like to have Series A plotted on the Left-Y axis, and Series B plotted on the Right-Y axis.
As far as I can see this isn’t possible though, right?
With multiple series that come from different queries, we will break up the axis for you. Can you screen shot what you see? Perhaps using a similar query against our sample dataset if you can’t share numbers or trends.
I'm not explaining this clearly. Consider this SQL query from the sample dataset:
select day_of_month(created_at), sum(subtotal),avg(subtotal)
from orders
group by day_of_month(created_at)
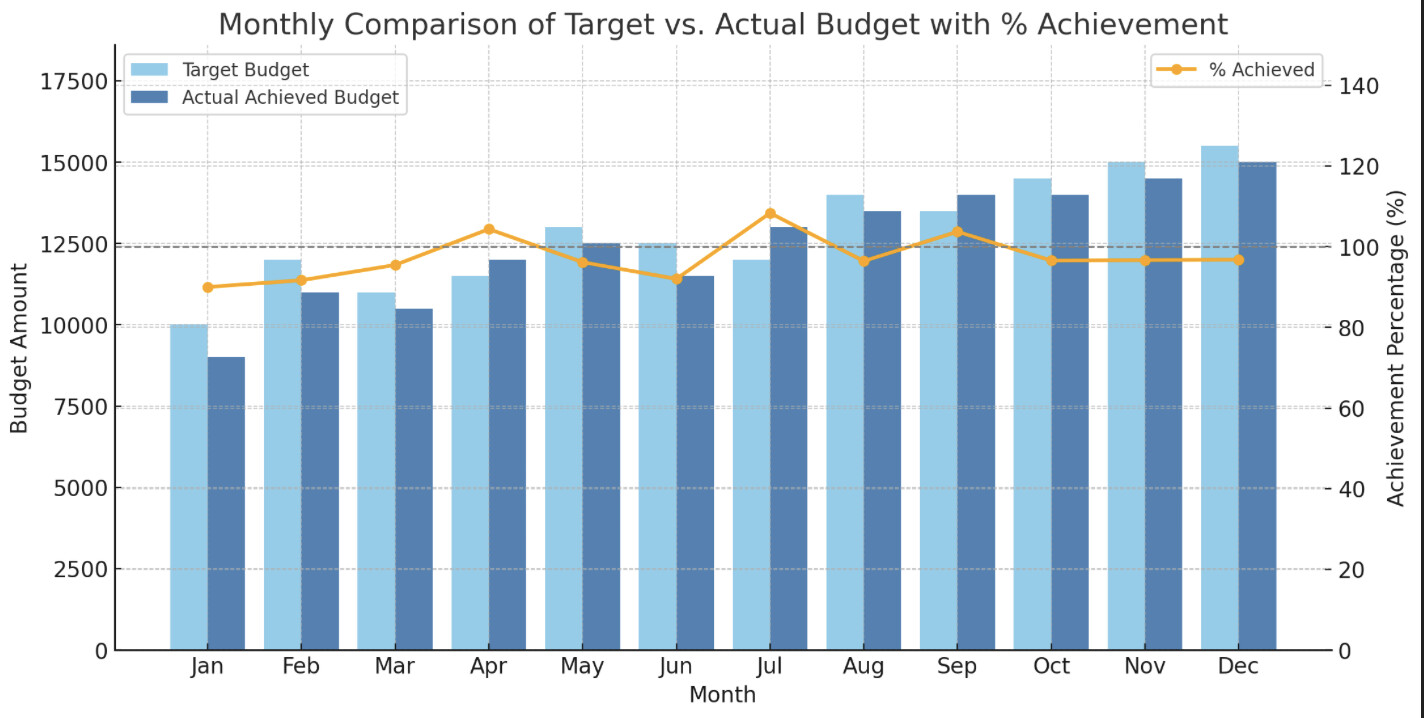
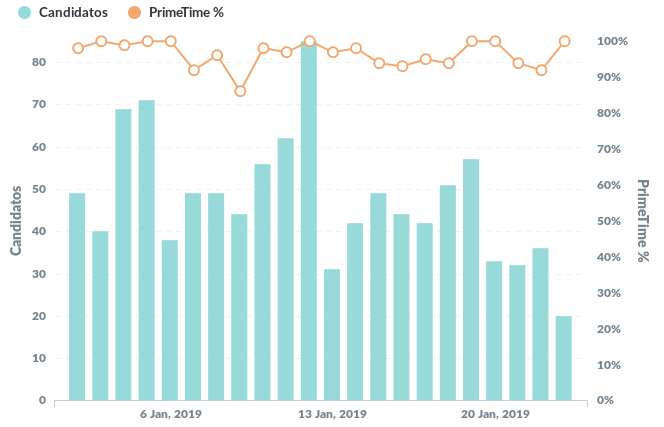
This makes a chart that looks like the first below.
However, I want the green line to be on a separate Y axis - the second image shows what can be done with the same raw data in excel (average is on the right-hand axis):

Does this make sense?
1 Like
any update on this?
I’m not sure when the feature was added but I can see v0.26.1 can have 2 different Y-axes for different sets of data. The new issue that arises is that the labels for those axes are shared. The first query will be used unless overridden in the graph’s settings.
Even in v0.28.1, the axes labels are shared. We now have the ability to update the labels for each series in the graph, but we are not able to update each label for the Y-axes yet.
Hi guys, has there been added functionality to control the label of the second y-axis independently (and scale, for that matter)? Not sure if this has been flagged as an enhancement yet or not.
Sorry if it has, I am still learning how to use this effectively.
1 Like
Hi @wrodg219
No, currently the label is defined by the first data element using the chosen y-axis.
And as for range, when it's not set to Auto, then the range defines both y-axis.
Currently looks like this in 0.31.2:
It looks like these issues - go and vote by clicking the ![]() on the first post:
on the first post:
"Use a split y-axis when necessary" not doing anything if "Auto y-axis range" is not selected · Issue #4778 · metabase/metabase · GitHub
Multiple properties bar chart · Issue #4114 · metabase/metabase · GitHub
how to Change the secondary y-axis label in multi series bar chart · Issue #5583 · metabase/metabase · GitHub
1 Like
Awesome, thank you @flamber for the reply. Looks like these are similar, so hopefully this will be an addition soon.