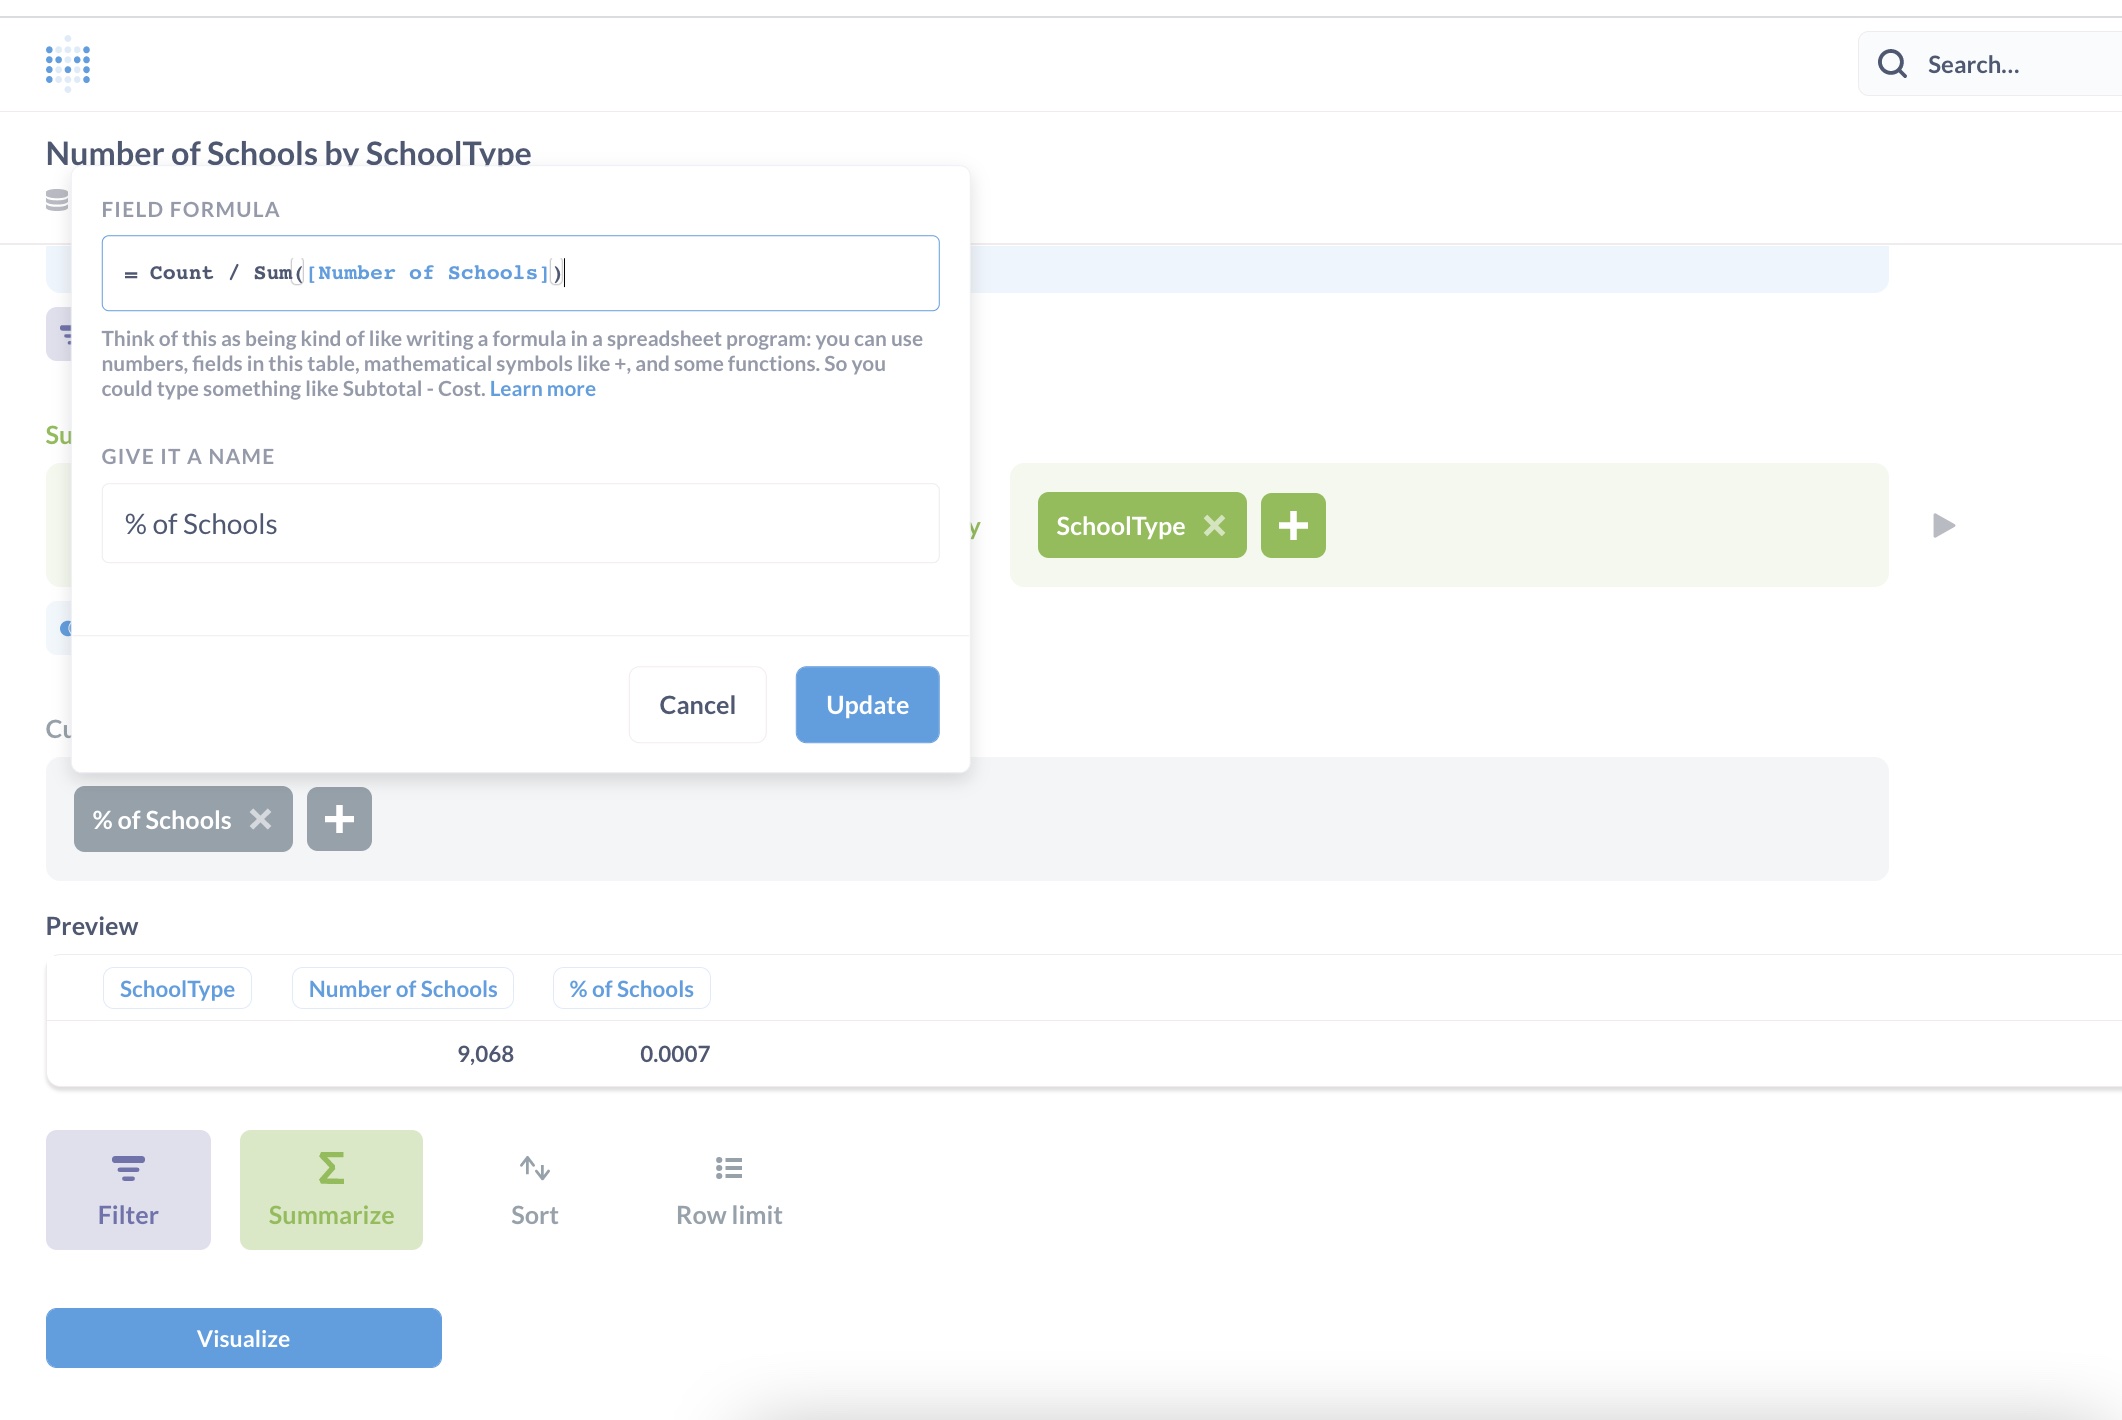
How do I add a column showing percentage of each school type in this example?

Whenever I add a custom column to calculate the percentage, it always just shows the first row with % instead of the whole list with a percentage.
How do I add a column showing percentage of each school type in this example?
Whenever I add a custom column to calculate the percentage, it always just shows the first row with % instead of the whole list with a percentage.
Hi @irene
Create a Custom Expression in the Summarize-section instead of creating a Custom Column:
https://www.metabase.com/learn/questions/custom-expressions.html#custom-summaries
Hi @flamber. Thanks for responding. I'm trying to add a 3rd column to that table to show the % for each row and the "Share" expression is only calculating one value at a time and returning the results, e.g. I'd have to enter the following one at a time in the Summarize field:
Share([SchoolType] = "Alternative") * 100
Share([SchoolType] = "Elementary") * 100
How do I just enter one formula so it calculate a new column showing the % for each row?
Here's a video of what I'm trying to do whichm might be clearer. https://www.loom.com/share/1b73bc8bfe9b44129d7c43c6961431da
@irene Most databases doesn't have a simple way of doing this without sub-query or windowing.
Metabase currently cannot do windowing in the GUI, and sub-query would either require two questions if done in the GUI or you'll have to use SQL.
With SQL you would do something like this:
SELECT "SchoolType", count(*) AS "Count", count(*)/(SELECT count(*)::float FROM "School") AS "Percent"
FROM "School"
GROUP BY 1
ORDER BY 2 DESC
There's a request for making this much easier:
https://github.com/metabase/metabase/issues/2120 - upvote by clicking  on the first post
Thanks @flamber
This is still not possible in the GUI, Metabase go fix!
I voted on github and added some more information (v0.50.23)
is this functionality avaialble now?
This is a useful example of a common challenge when trying to calculate percentages in Metabase. It’s interesting to see how a custom column can behave differently from a calculation based on the full result set. The discussion is especially helpful for understanding the right approach to displaying each category’s percentage of the total.
I was thinking of a way to solve this issue for Metabase (I’m not a dev, so I’m just using basic logic here, haha) and came up with two possible approaches:
Enable the creation of a "pivot-grouping" column—which already exists internally within the Pivot Table—to assist with percentage calculations. Having control over this would be a huge help and would provide more autonomy when building visualizations;
(More complex) Change the Pivot Table creation workflow. Right now, we create a query and the visualization adapts to the resulting table. The idea would be to reverse that flow: first, we select the visualization type, and it presents the available calculation options. E.g, if I select "Pivot Table," I would have a query for the table body, a query for the totals (customized or otherwise), and a way to apply the total formula to all subtotals. This idea stems from the fact that some calculations apply equally to the table body and the totals. E.g, if I want to calculate the sales percentage change between years (current_year / previous_year - 1), that same calculation applies to both the subtotal and total rows.
Sorry for the long message, but this is a topic that hasn't seen much progress, and honestly, we aren't sure where things stand with it.
You can do it with 1 question for the grand total, then another with the total per school. Join them and you can do the calculation.
Yeah... That works well with one total or two at most... but if we have a table with more subtotals, it’s not worth creating multiple questions. I have an example from a retail company where we have a hierarchy of 7 or 8 levels, haha.
Yes, hierarchies are always a problem. I’m working with 3 levels, so multiple questions are fine.
Alternative is to do a clever view. In Postgres, I’d probably use a function for flexibility.