Hey,
first of all, thanks for metabase, it is awesome!
Second, I set it up, everything is working fine and we created some dashboards.
With one dashboard I have some struggle, I’m shure I draw a mental blank so I hope, that someone can help me
We have a lot of testing probes (Water-level-mesurement of ground water). All Data is stored in one table of the database,
simplified: data_ID, DATE+TIME, waterheight, ID_of_sonde
example: 2456687;2020-09-15-09-45; 112.45; T231
There are several hundrets of sonde, each with its own ID_of_sonde. Every sonde has a lot of data, so a lot of rows in the table; also they measure at the same time - so at same timesteps, there are same DATE+TIME with different waterheights and different ID_of_sonde.
We need a dashboard, which shows the trend of one and more sonde in one diagram (one polyline for each sonde). X: time, Y: waterheight.
Metabase makes one large graph with an note (not-aggregated field DATE+TIME, because there are more values to the same time; that’s comprehensible, because there is no filter for a single sonde).
If I want to display the measurements in an way, that every sonde has it’s own graph, I need (in my way) for every sonde a single question. - And there lie my problem: I need to create hundrets of questions.
We have some other sonde (for rain), this are 10 and it’s okay. But for hundrets (and more are coming), this is a very time-intensive task.
Is there a chance to create different graphs for each ID_of_sonde of the single table automatically?
… like "filter for ID_of_sonde and draw for each ID_of_sonde a graph, additional show us the filter in the
dashboard (like the Field filter widget), that users can turn off graphs, which they don’t need.
Thanks for reading this wall of text, I hope I could express my problem (no native speaker).
I hope, there will be a possibility for this requirements.
hi @flamber,
thanks a lot for you help. Sadly, I don’t get it, so I have another question:
I took a step back, used the sample-dataset and your links. in Your First link, the Figure 1 shows exactly what we need:
SELECT *
FROM orders
LEFT JOIN products
ON orders.product_id = products.id
WHERE {{category}};
But I get just one polyline.
I also tried the “GROUP BY” in it, like I thought it would be correct:
SELECT *
FROM orders
LEFT JOIN products
ON orders.product_id = products.id
WHERE {{category}}
group by orders.product_id
ORDER BY CREATED_AT
but then, the error " Column “ORDERS.ID” must be in the GROUP BY list; " occures and after adding orders.id (but thats illogical for me) the query works, but the diagram shows only one polyline.
Could you give me a hint? I think i don’t see the wood for the trees :-S
@TubiFex Which database are you querying? Your query needs to follow the syntax of that database, just like the Sample Dataset needs to follow the syntax of H2.
Every non-aggregated column you add to the SELECT-clause needs to be in the GROUP-clause too.
SELECT products.category, COUNT(*), SUM(orders.total)
FROM orders
LEFT JOIN products
ON orders.product_id = products.id
WHERE {{category}}
GROUP BY products.category
@flamber thanks a lot for your anwser!
I use postgreSQL, but now the sample dataset (H2) to learn to walk at this question.
If you want to take the orders.CREATED_AT at the x-axis and just the orders.total on the y-axis (one graph for every category). And this without sum up a metric, how can you do this?
Like the gif i posted without sum, but just the order.total trend on time for each category in one graph.
That would be similar to my problem with the groundwater measuring points, the “sondes”.
@TubiFex Okay, Postgres has a syntax close to H2.
If you don’t want to sum the values, then you’ll want to do something like this:
SELECT orders.id, orders.created_at, orders.total, products.category
FROM orders
LEFT JOIN products ON orders.product_id = products.id
WHERE {{category}}
GROUP BY orders.id, orders.created_at, orders.total, products.category
But it has nothing to do with Metabase - this is basic SQL querying. You should create your query without filter variables, so you know exactly how it should work and then you can add filters.
@flamber Thanks for you reply
Your example was exactly what I wrote at testing now.
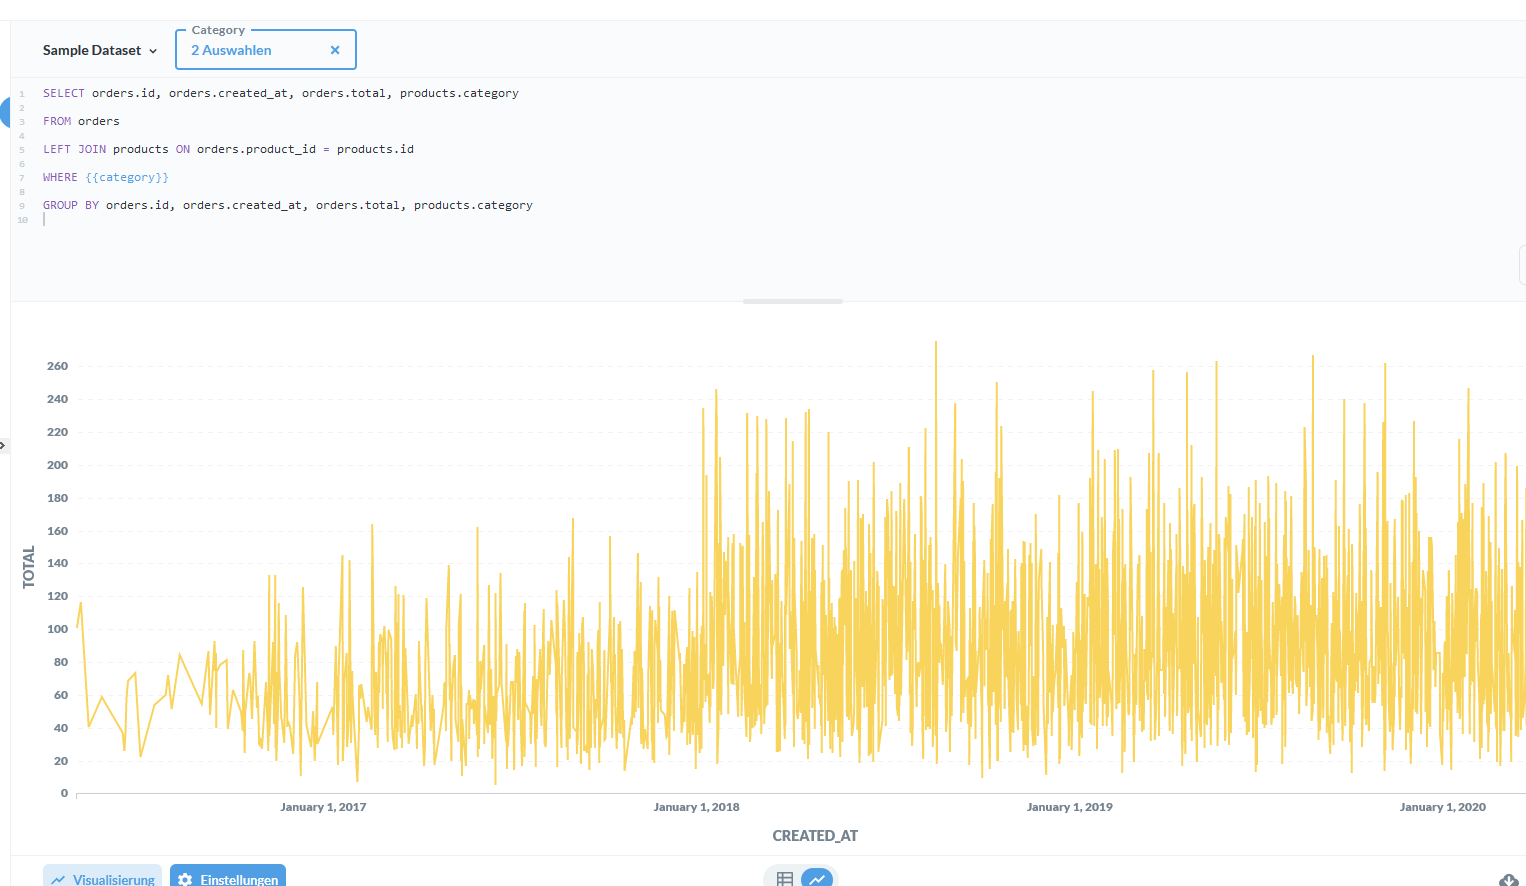
But at my question/dashboard there is no differention between the categories in the diagram, here is what I get:
There is always this huge, solo polyline and no grouping for each category in one graph each category, like in the gif, I posted. Is there an option I missed? I didn't modify the example database.
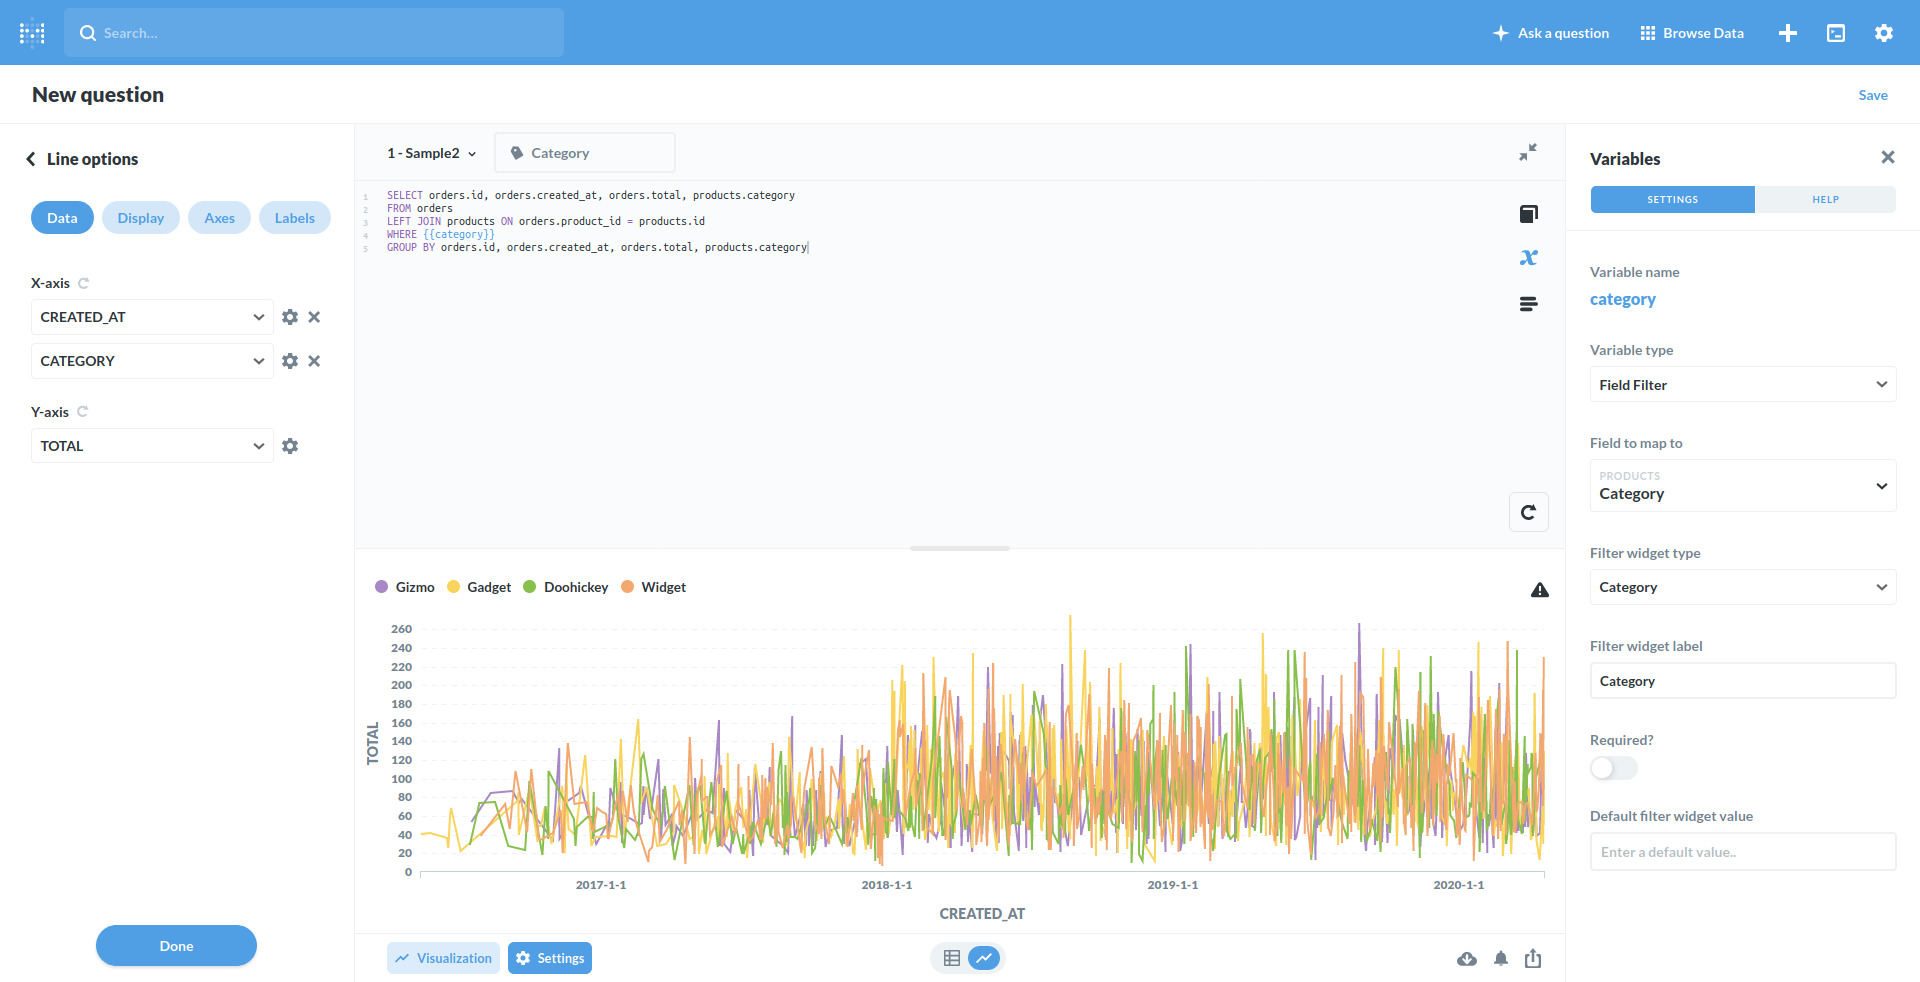
@ flamer Awesome! I feel incredibly happy about this feature, but very dumb also >.<
Now it is working flawless; I’m sorry for the red herring with the SQL.