Hi guys!!
I need a little help over here.
I love the Metabase and I'm a beginner in it.
So, I have a lot of graphics and lines of data, but I need to show the value of my data in each point of my graphs.
I read the document and I found there something that tell about it, but don't explain how that I do.
There it is:
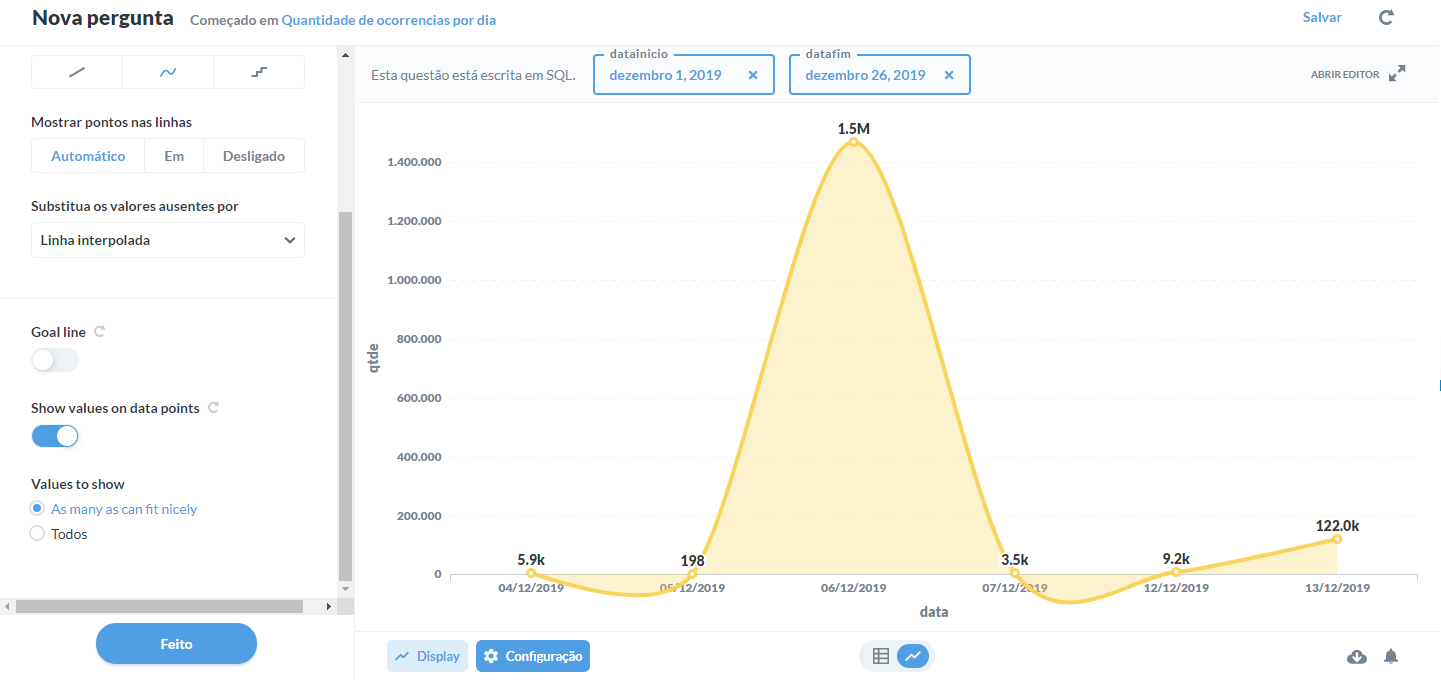
"Show values on data points. The default setting will try and fit as many values on your chart as will fit nicely, but you can also force Metabase to show the values for each and every data point, which it will do begrudgingly."
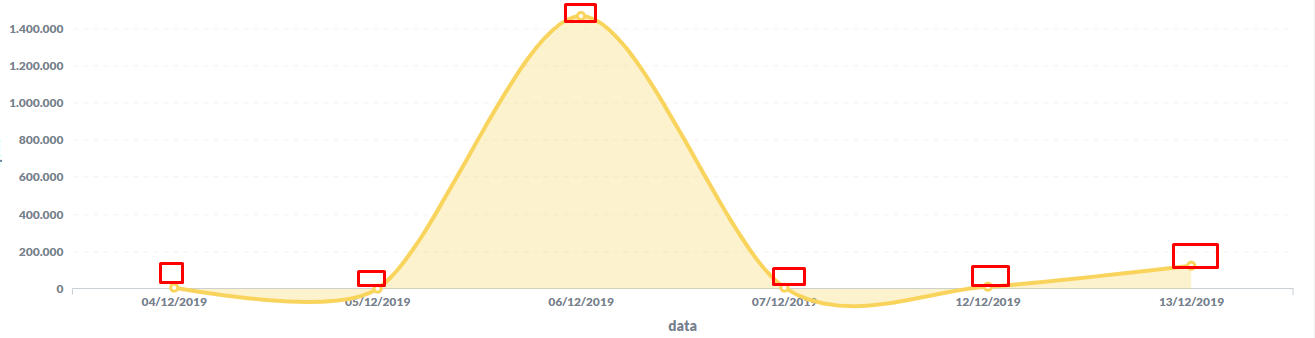
To exemple what I'm talking about, where is the red mark is the data of the each point of information that I need to show up
Hi @puglisi
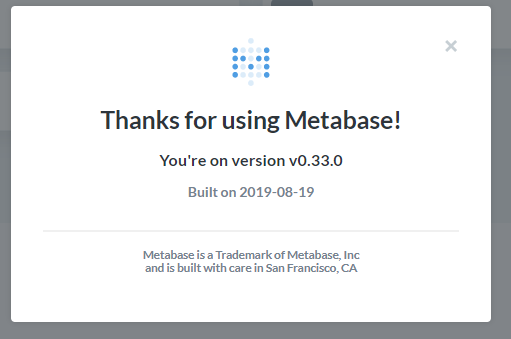
Are you using version 0.34.0?
I'm a little confused. Are you asking where to enable data points?
Click the visualization Settings > Display > activate "Show values on data points" in the bottom and click "All".
@puglisi Great that we could find the cause of this
I can see that some of the strings have not been translated in Portuguese, so if you want to help out with that, then visit https://poeditor.com/join/project/ynjQmwSsGh
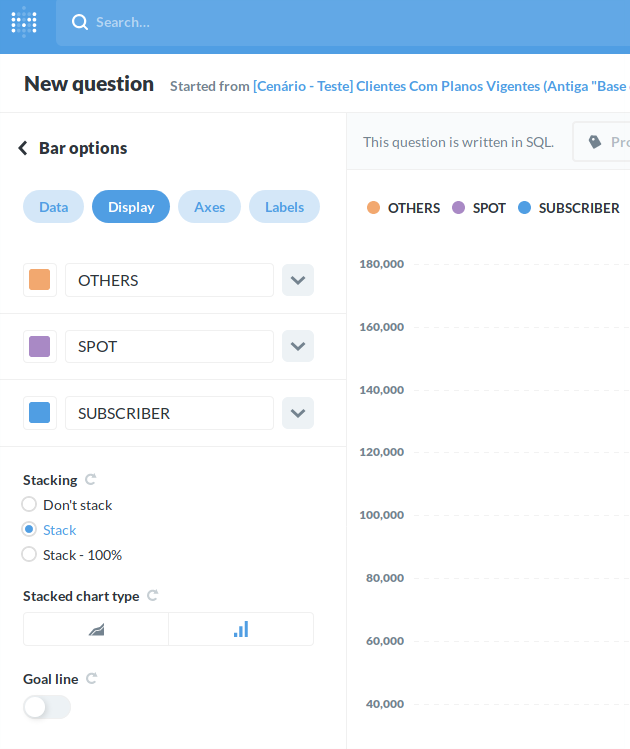
@camilamorais, this feature currently is limited to charts with a single series. The option isn’t showing up because you have 3 series: OTHERS, SPOT, and SUBSCRIBER. The option will show up if you only have one of those three. We plan on improving this feature soon to enable it to work with multiple series.
Hey guys!
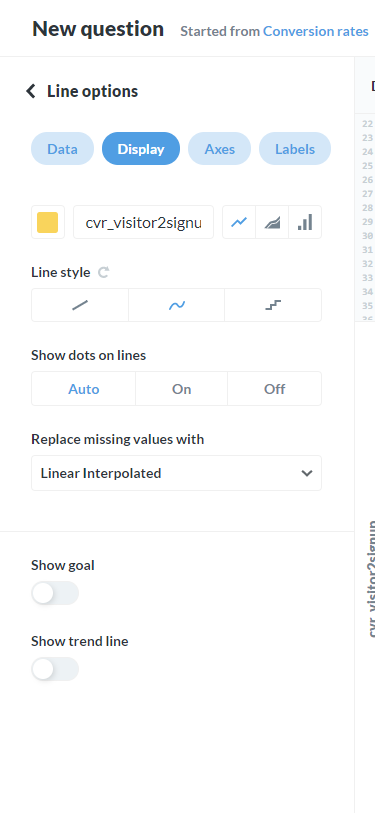
I exactly have the same problem but the solution you provided doesn't work for me, even though I am plotting a simple line graph.
Anybody can help me with it?
Thanks in advance!
@elysee Yes, it’s only available since 0.34.0 - I would recommend that you upgrade at some point to the latest release (currently 0.34.3), just remember to backup before in case something goes wrong or if you quickly want to revert.


 on the first post of each: