Hi !
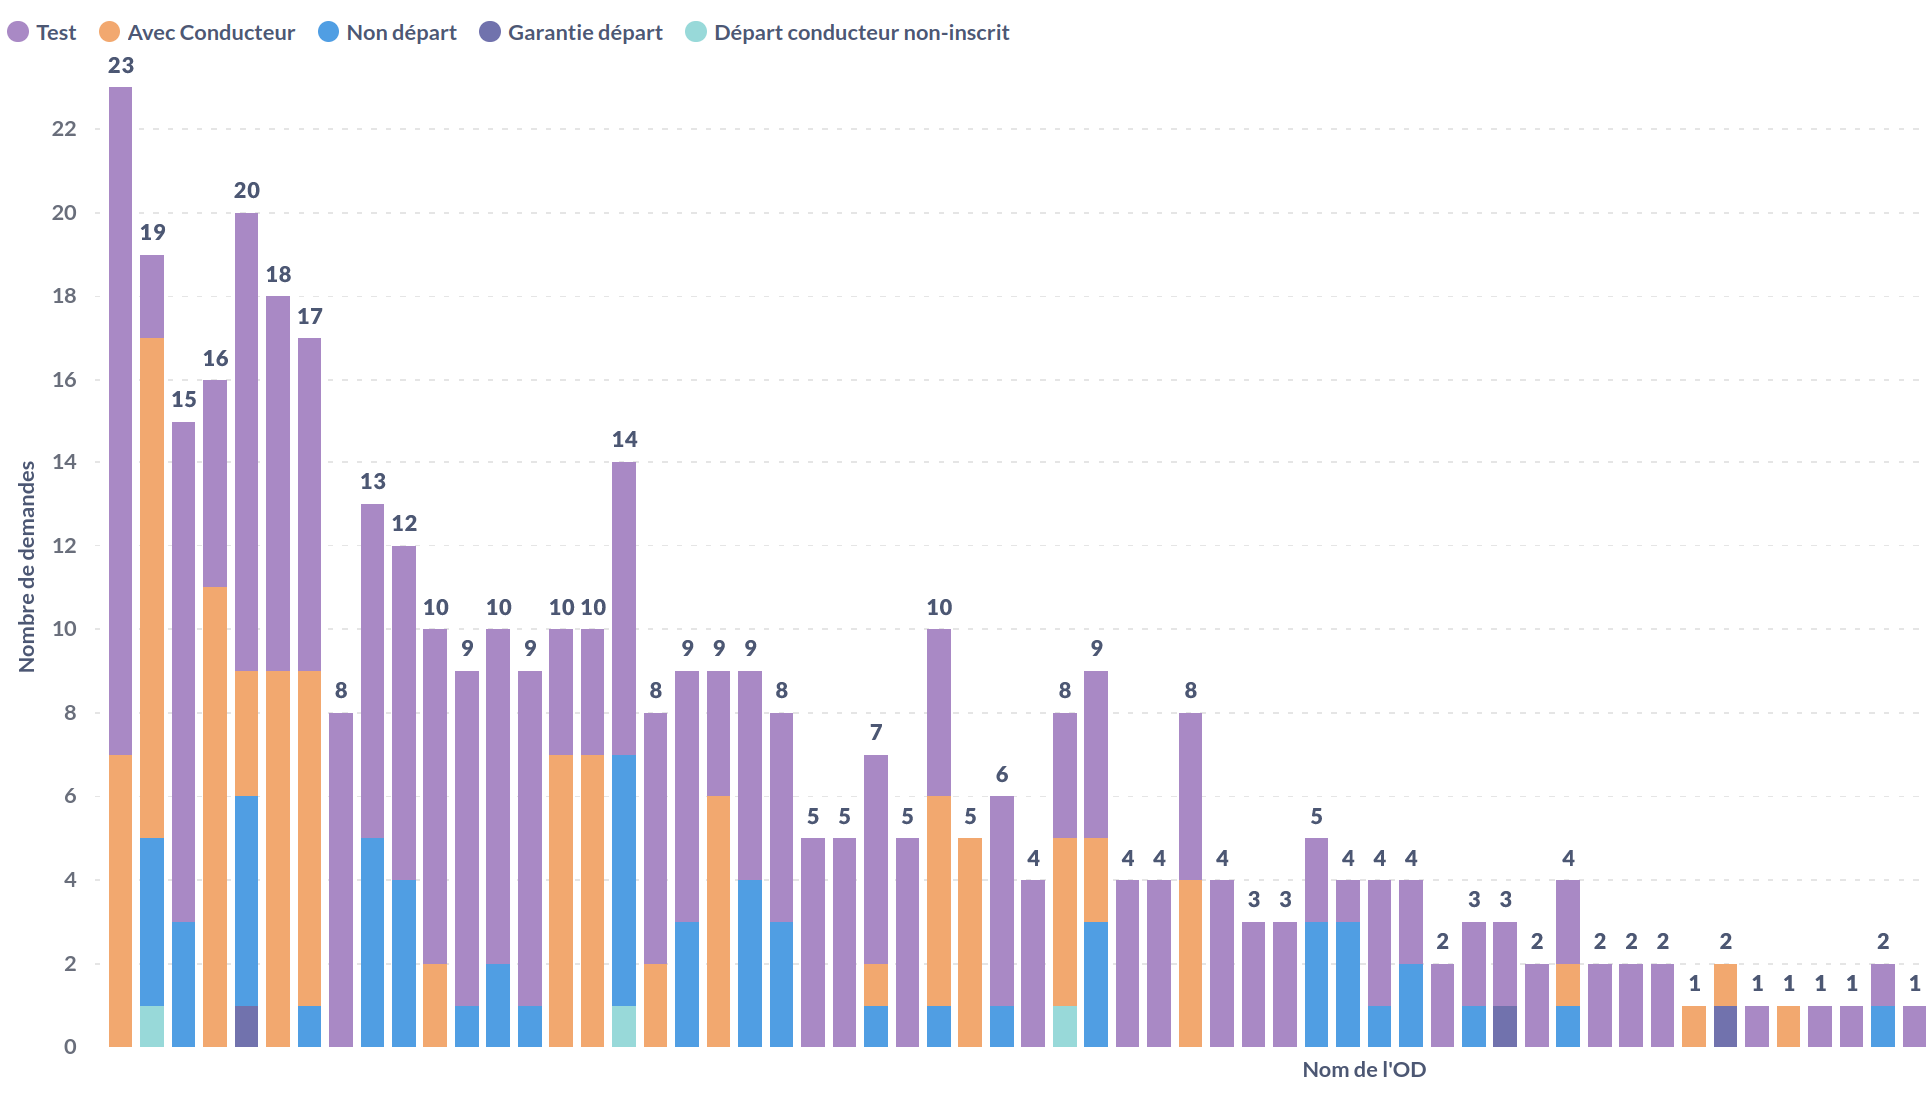
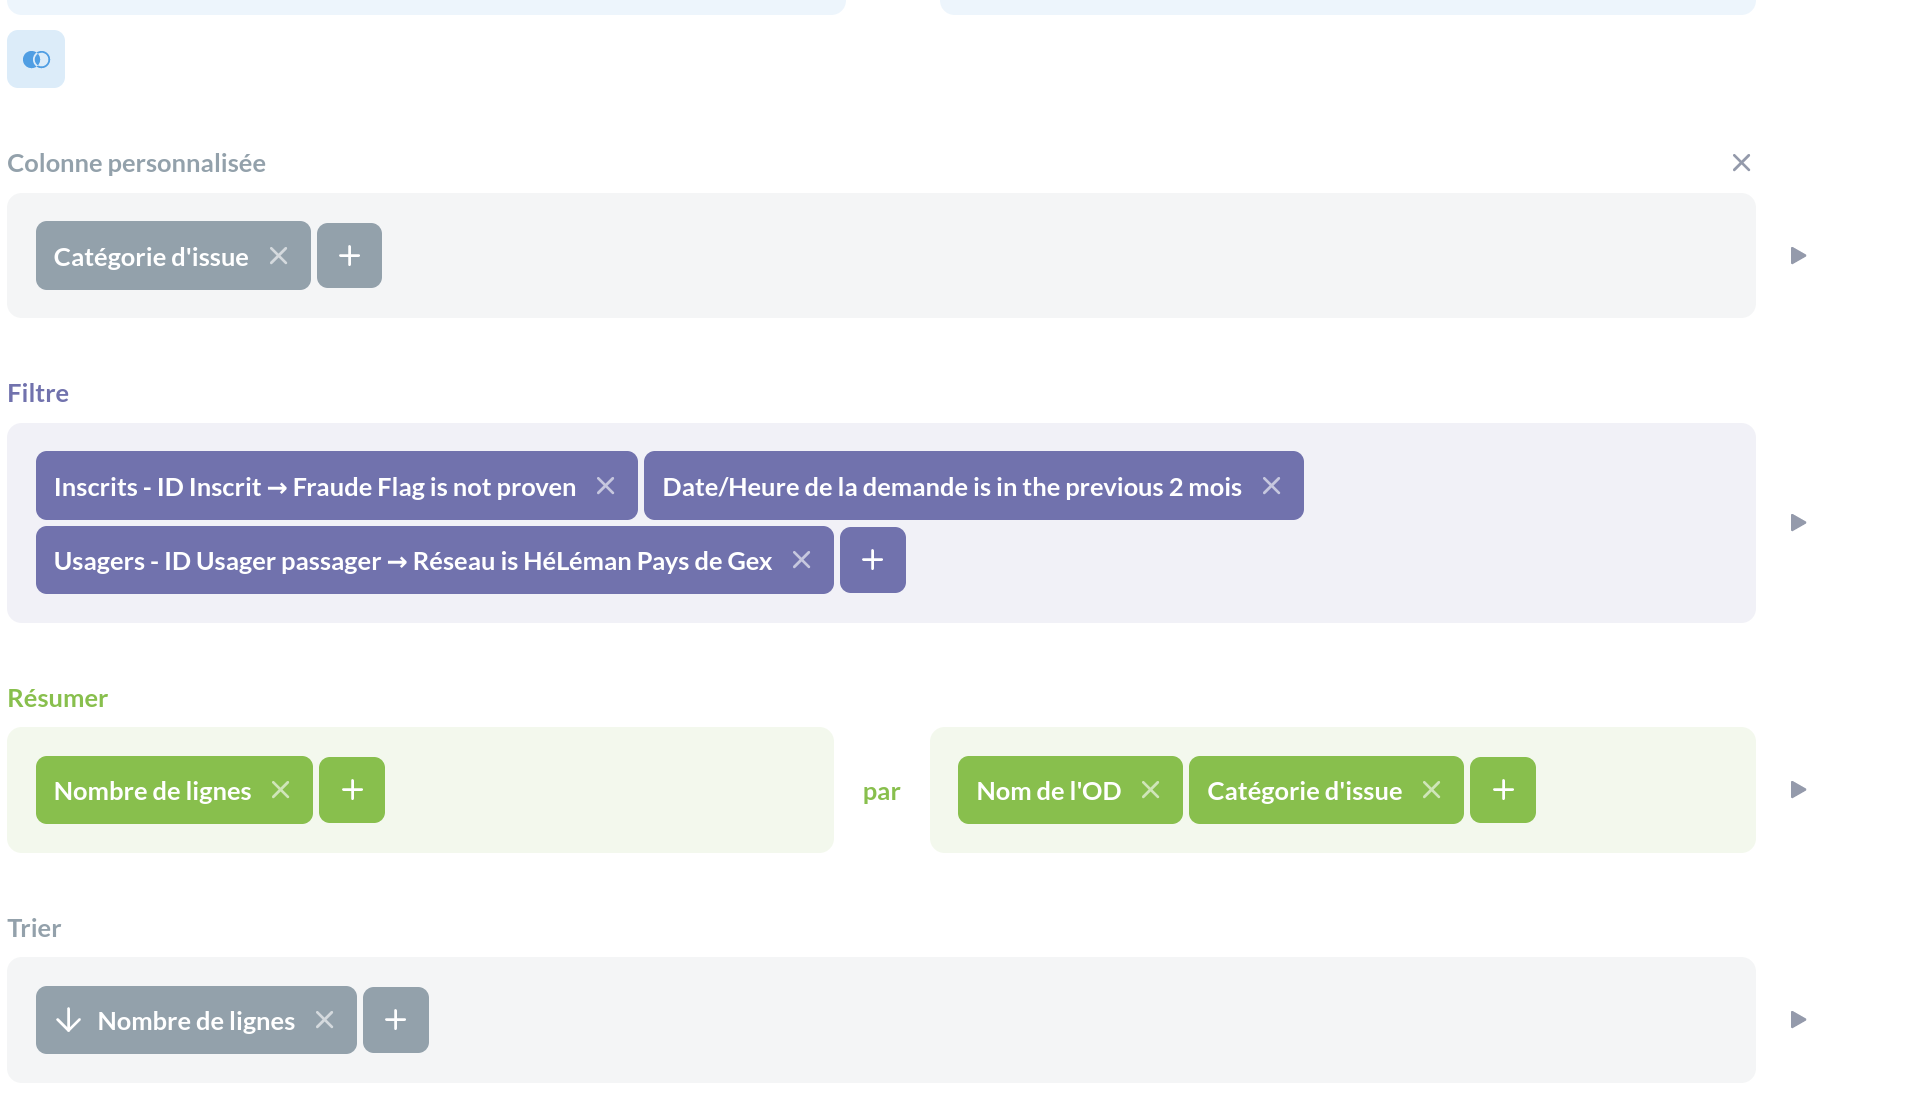
I'm working with V0.49 and I can't order a stacked bar chart in a simple query :
I can't understand why. I looked in another topics but without success.
TonyC
June 3, 2024, 12:29pm
2
You are ordering by theNombre de lingers. Not by the SUM(Nombre de lingnes) ... The stacked chart sums up the value on the frontend but doesn't use the logic order. Change from stacked to table and you will see how metabase is ordering your table. Which is applying the same order on the chart.
But when you stack the visual adds stuff up. Since you have multiple breakdowns, also for reference:
opened 09:42AM - 23 Oct 23 UTC
Type:Bug
Priority:P2
Visualization/
.Frontend
.echarts-scope
.Team/DashViz
### Describe the bug
When you have multiple breakdown in the chart the sorting … is not consistent with what you select
### To Reproduce
1. Go to New -> Question -> Product -> Summarize by Count and Group by Category, Created: At Month -> Sort by Created At & Count
<img width="1297" alt="image" src="https://github.com/metabase/metabase/assets/110378427/ee2e6d1d-b018-4a77-ae42-0f8efaeb07c6">
2. Visualise -> Have a look at the table view for the Products in July and notice the sorting works ( 1, 1, 2, 3) :
<img width="998" alt="image" src="https://github.com/metabase/metabase/assets/110378427/1510f9ce-f17b-463f-b7ac-f5559760ce98">
3: Visualise as a Bar Chart and notice the sorting doesn't match and looks kind of random (1, 2, 3, 1):
<img width="1503" alt="image" src="https://github.com/metabase/metabase/assets/110378427/df0f4e35-ef83-46bc-94fb-688fb51f8bfd">
**NOTE: This happens on other charts and even when using stacking**
### Expected behavior
Sorting should be consistent
### Logs
None that are relevant
### Information about your Metabase installation
```JSON
1.47.5 and master
```
### Severity
Annoying if you want to properly showcase data that is incrementing
### Additional context
_No response_