I've hit this a couple of times in recent weeks and am not sure if I'm missing something, or if it is not possible, ... . Any hints are appreciated!
In our database, there's some model with a property that describes its category (e.g. column fruit with property type that could be apple, banana, ananas, ...).
I now want to show the current amounts of these categories - how many entries with category apple, banana, ... etc are there.
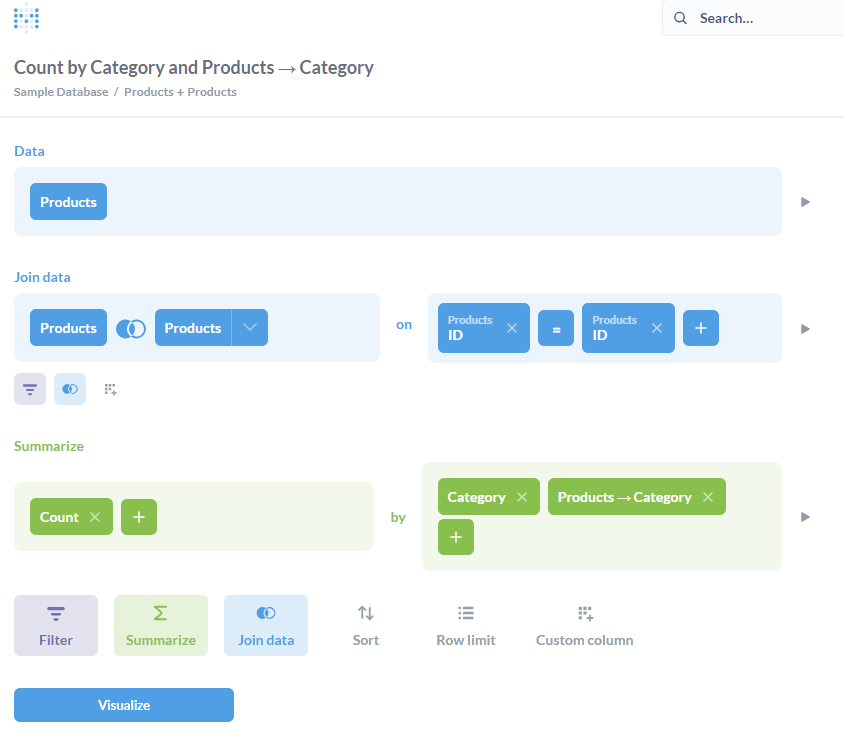
So what I do is
- Query builder
- Select the model under data
- Summarize by COUNT of
property
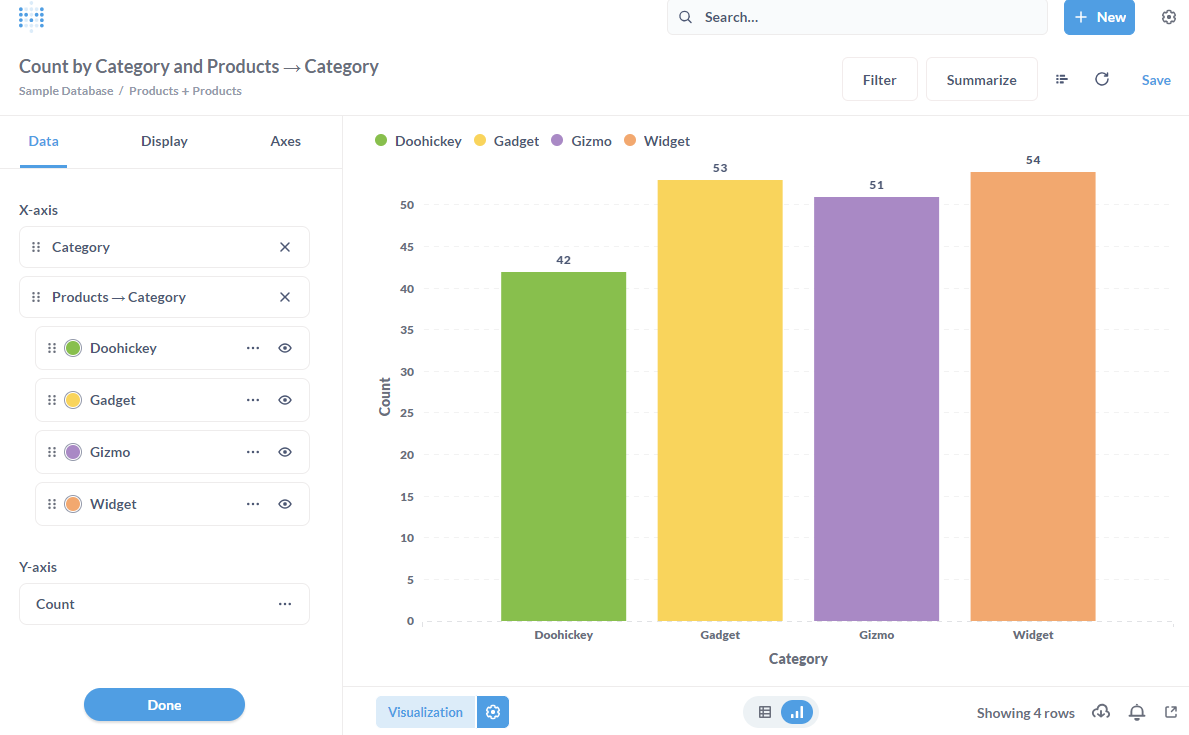
This gives me a nice bar chart with one bar for apple, one for banana, ... . However, all bars are shown in the same color, and the options only allow to change that single color.
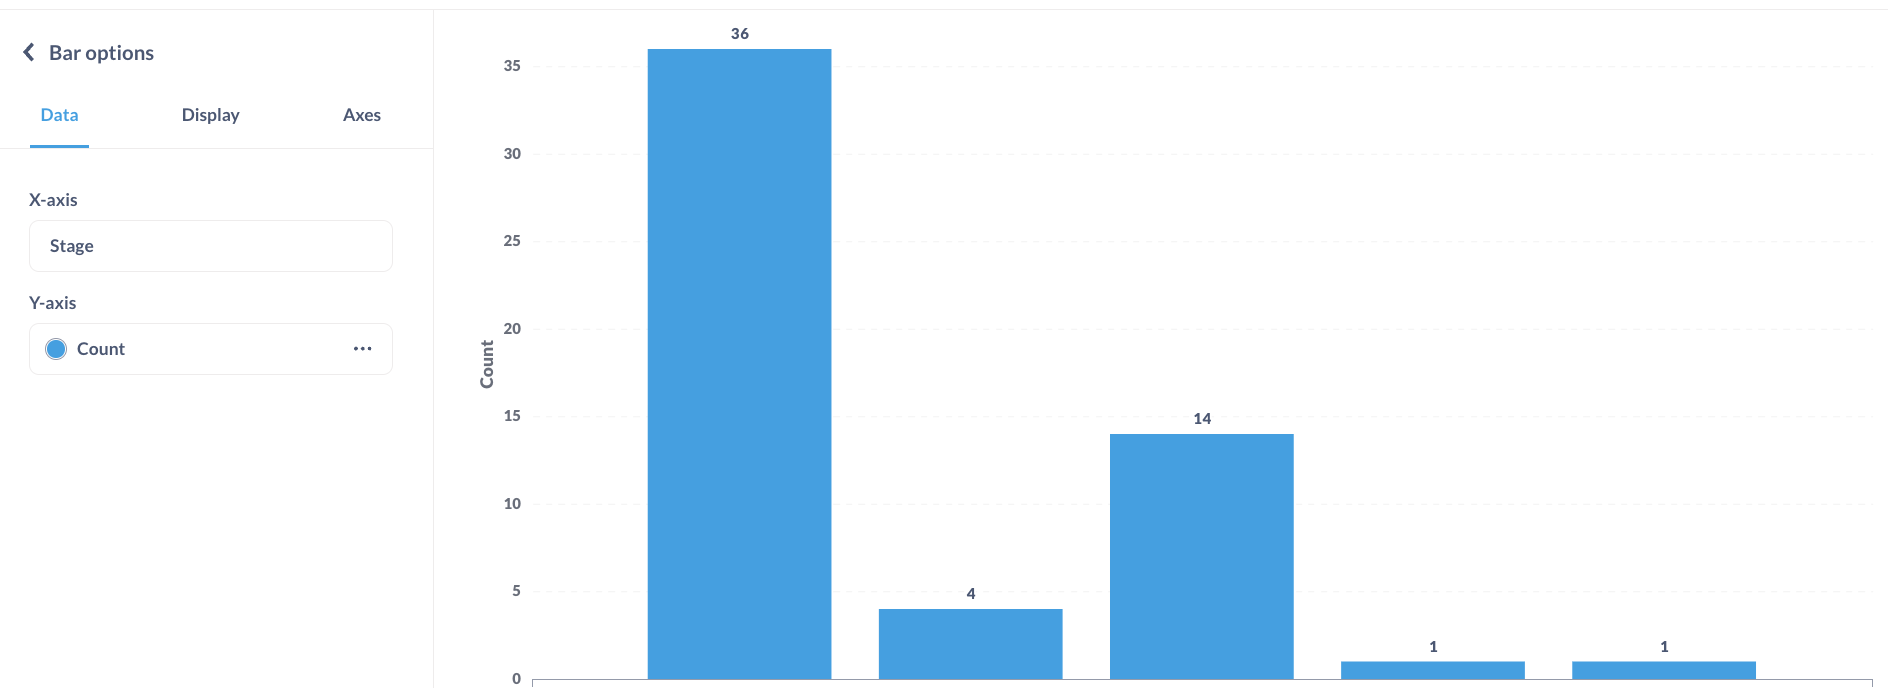
Is there any simple way to chose custom colors (so that the bar for apple could be colored red, banana yellow, ...)?
I've searched a bit on github and in the forum, but only found answers related to more complex things (stacked bar charts, time series with trends, ...).