Hi!
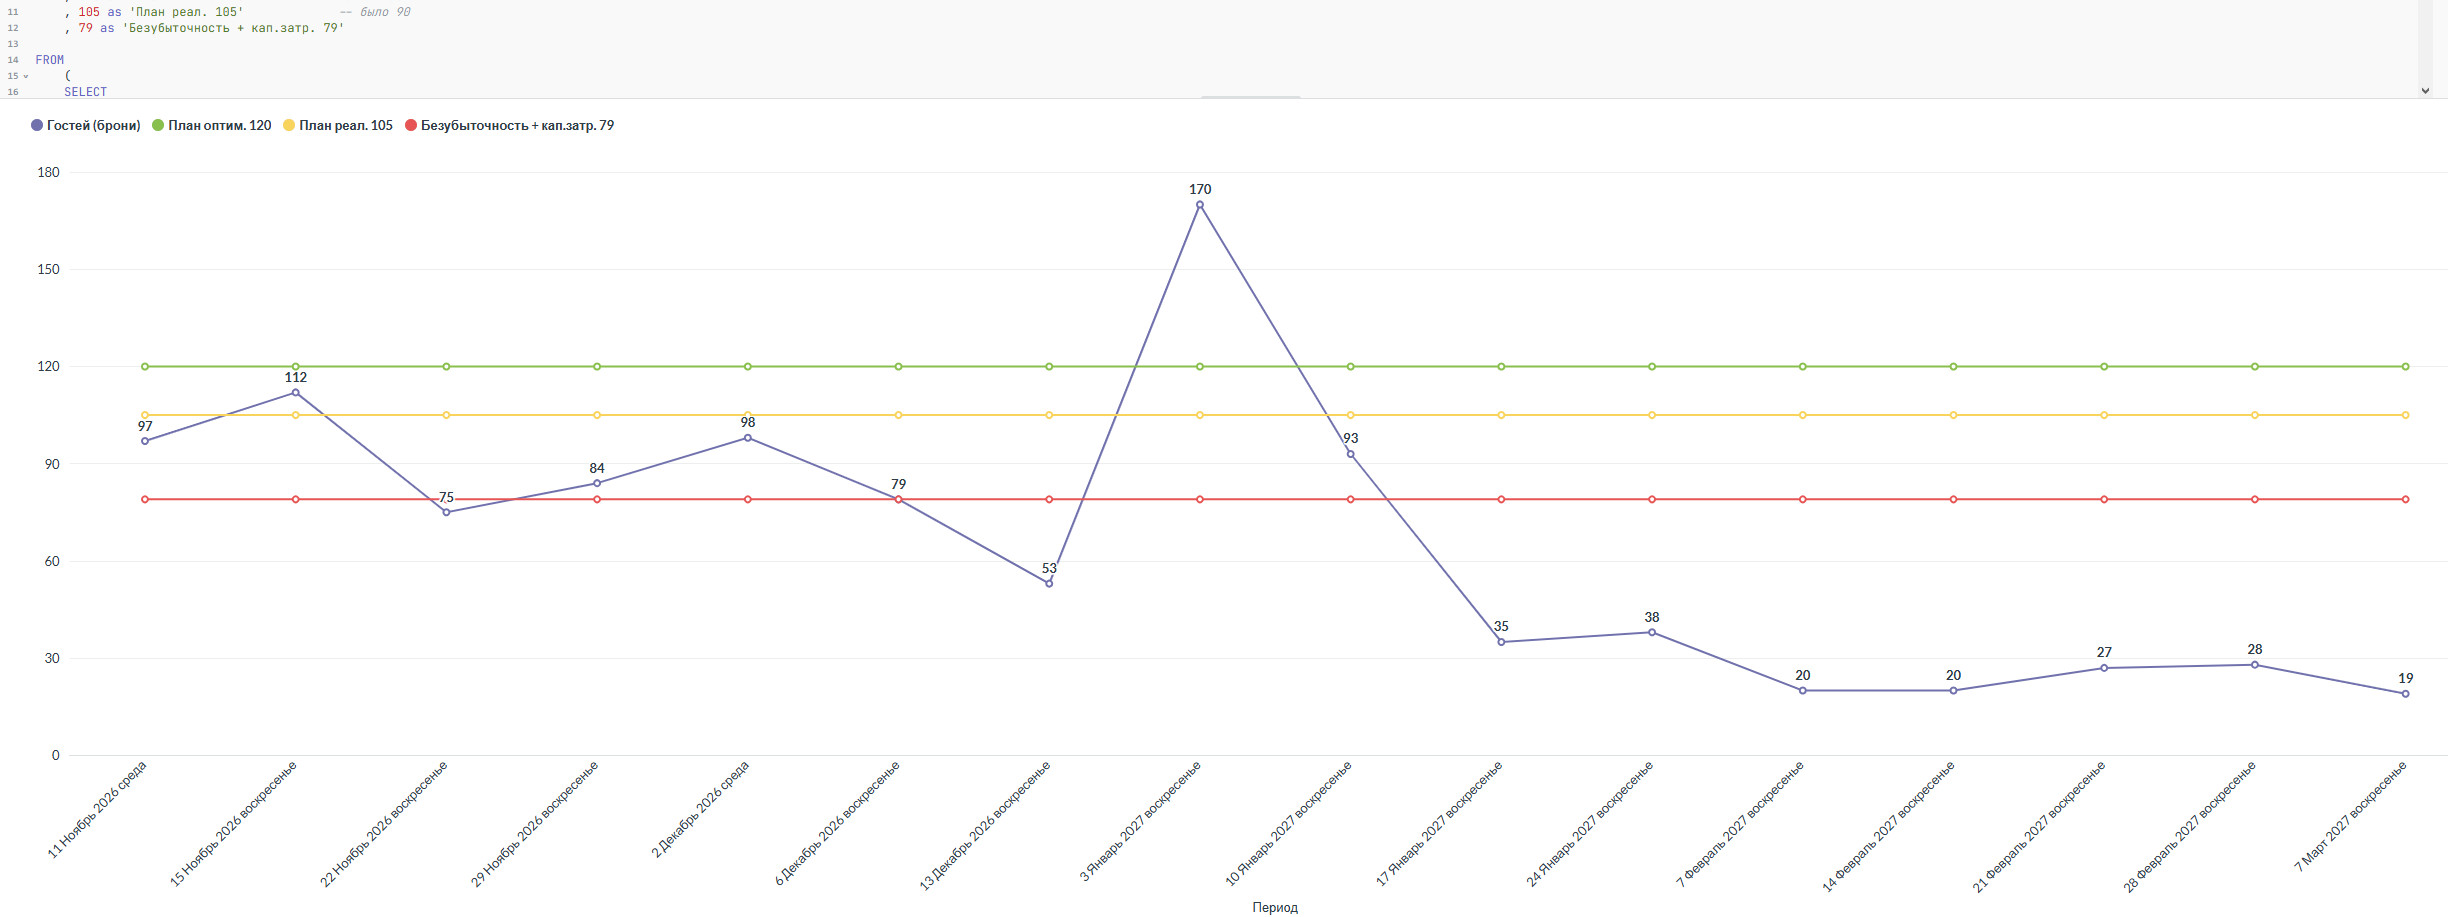
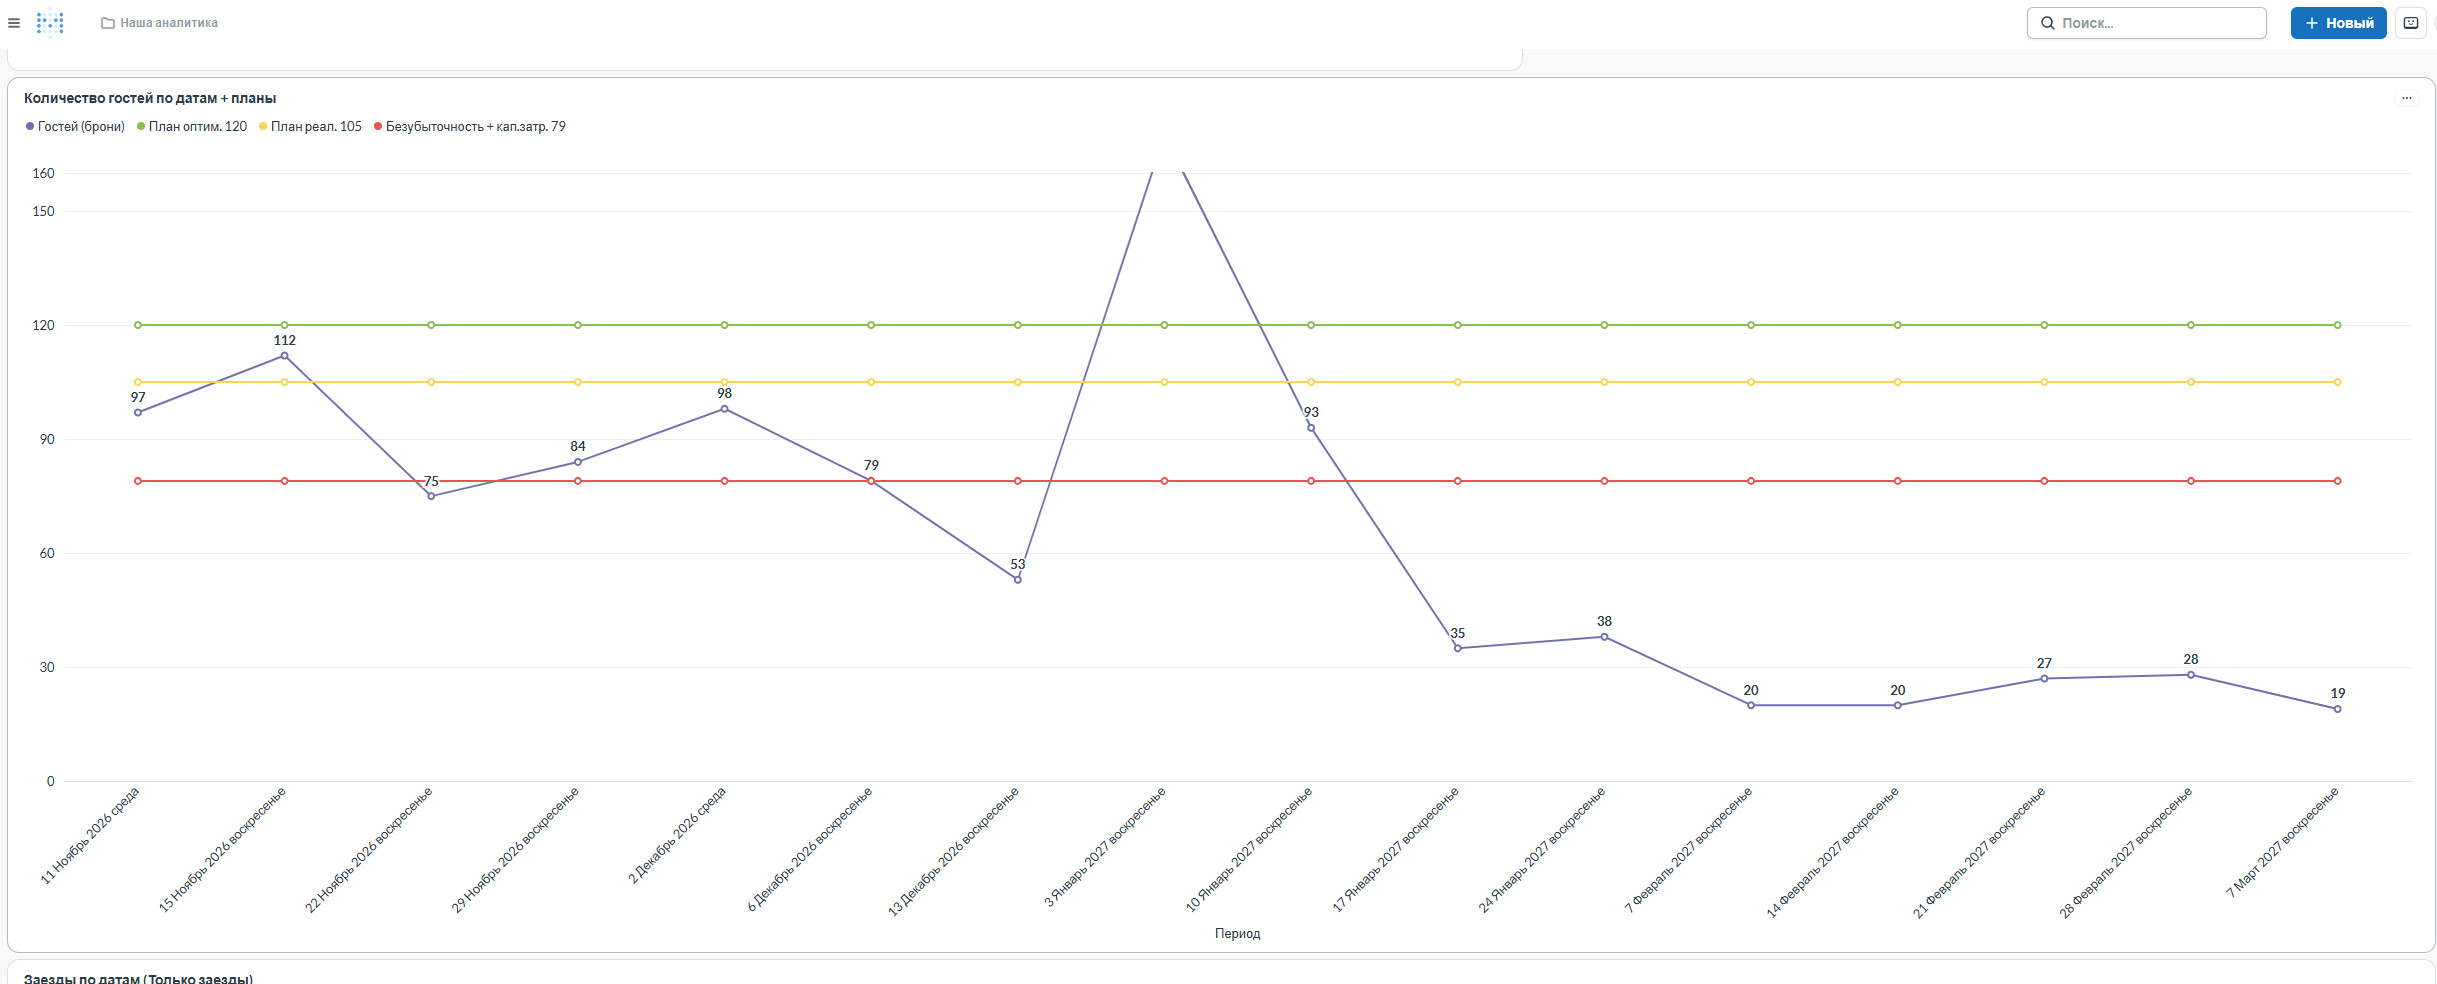
The scale doesn't work. not all values are visible on the chart
Everything is normal in the editing and schedule settings mode.
And when adding a graph to the dashboard, the maximum values are not visible.
I changed the display height. It doesn't help.
How can this be fixed?
Thanks!
Metabase 0.65.3.7
This is the development mode. Everything is OK here:
It's on the dashboard. Not visible 70
{
  "browser-info": {
    "language": "ru-RU",
    "platform": "Win32",
    "userAgent": "Mozilla/5.0 (Windows NT 10.0; Win64; x64) AppleWebKit/537.36 (KHTML, like Gecko) Chrome/155.0.0.0 Safari/537.36 OPR/139.0.0.0",
    "vendor": "Google Inc."
  },
  "metabase-info": {
    "databases": [
      "postgres",
      "sqlite",
      "sqlserver"
    ],
    "run-mode": "prod",
    "plan-alias": "",
    "version": {
      "date": "2026-11-09",
      "tag": "v0.65.3.7",
      "hash": "86e5bd7"
    },
    "settings": {
      "report-timezone": "Europe/Moscow"
    },
    "hosting-env": "unknown",
    "application-database": "postgres",
    "application-database-details": {
      "database": {
        "name": "PostgreSQL",
        "version": "15.19 (Debian 15.19-1.pgdg13+2)"
      },
      "jdbc-driver": {
        "name": "PostgreSQL JDBC Driver",
        "version": "42.7.14"
      }
    }
  },
  "system-info": {
    "file.encoding": "UTF-8",
    "java.runtime.name": "OpenJDK Runtime Environment",
    "java.runtime.version": "25.0.5+8-LTS",
    "java.vendor": "Eclipse Adoptium",
    "java.vendor.url": "https://adoptium.net/",
    "java.version": "25.0.5",
    "java.vm.name": "OpenJDK 64-Bit Server VM",
    "java.vm.version": "25.0.5+8-LTS",
    "jvm.available-processors": 4,
    "jvm.max-memory": "2.9 GB",
    "os.name": "Linux",
    "os.version": "4.15.0-213-generic",
    "system.total-memory": "11.7 GB",
    "user.language": "en",
    "user.timezone": "GMT"
  }
}
