Hi there,
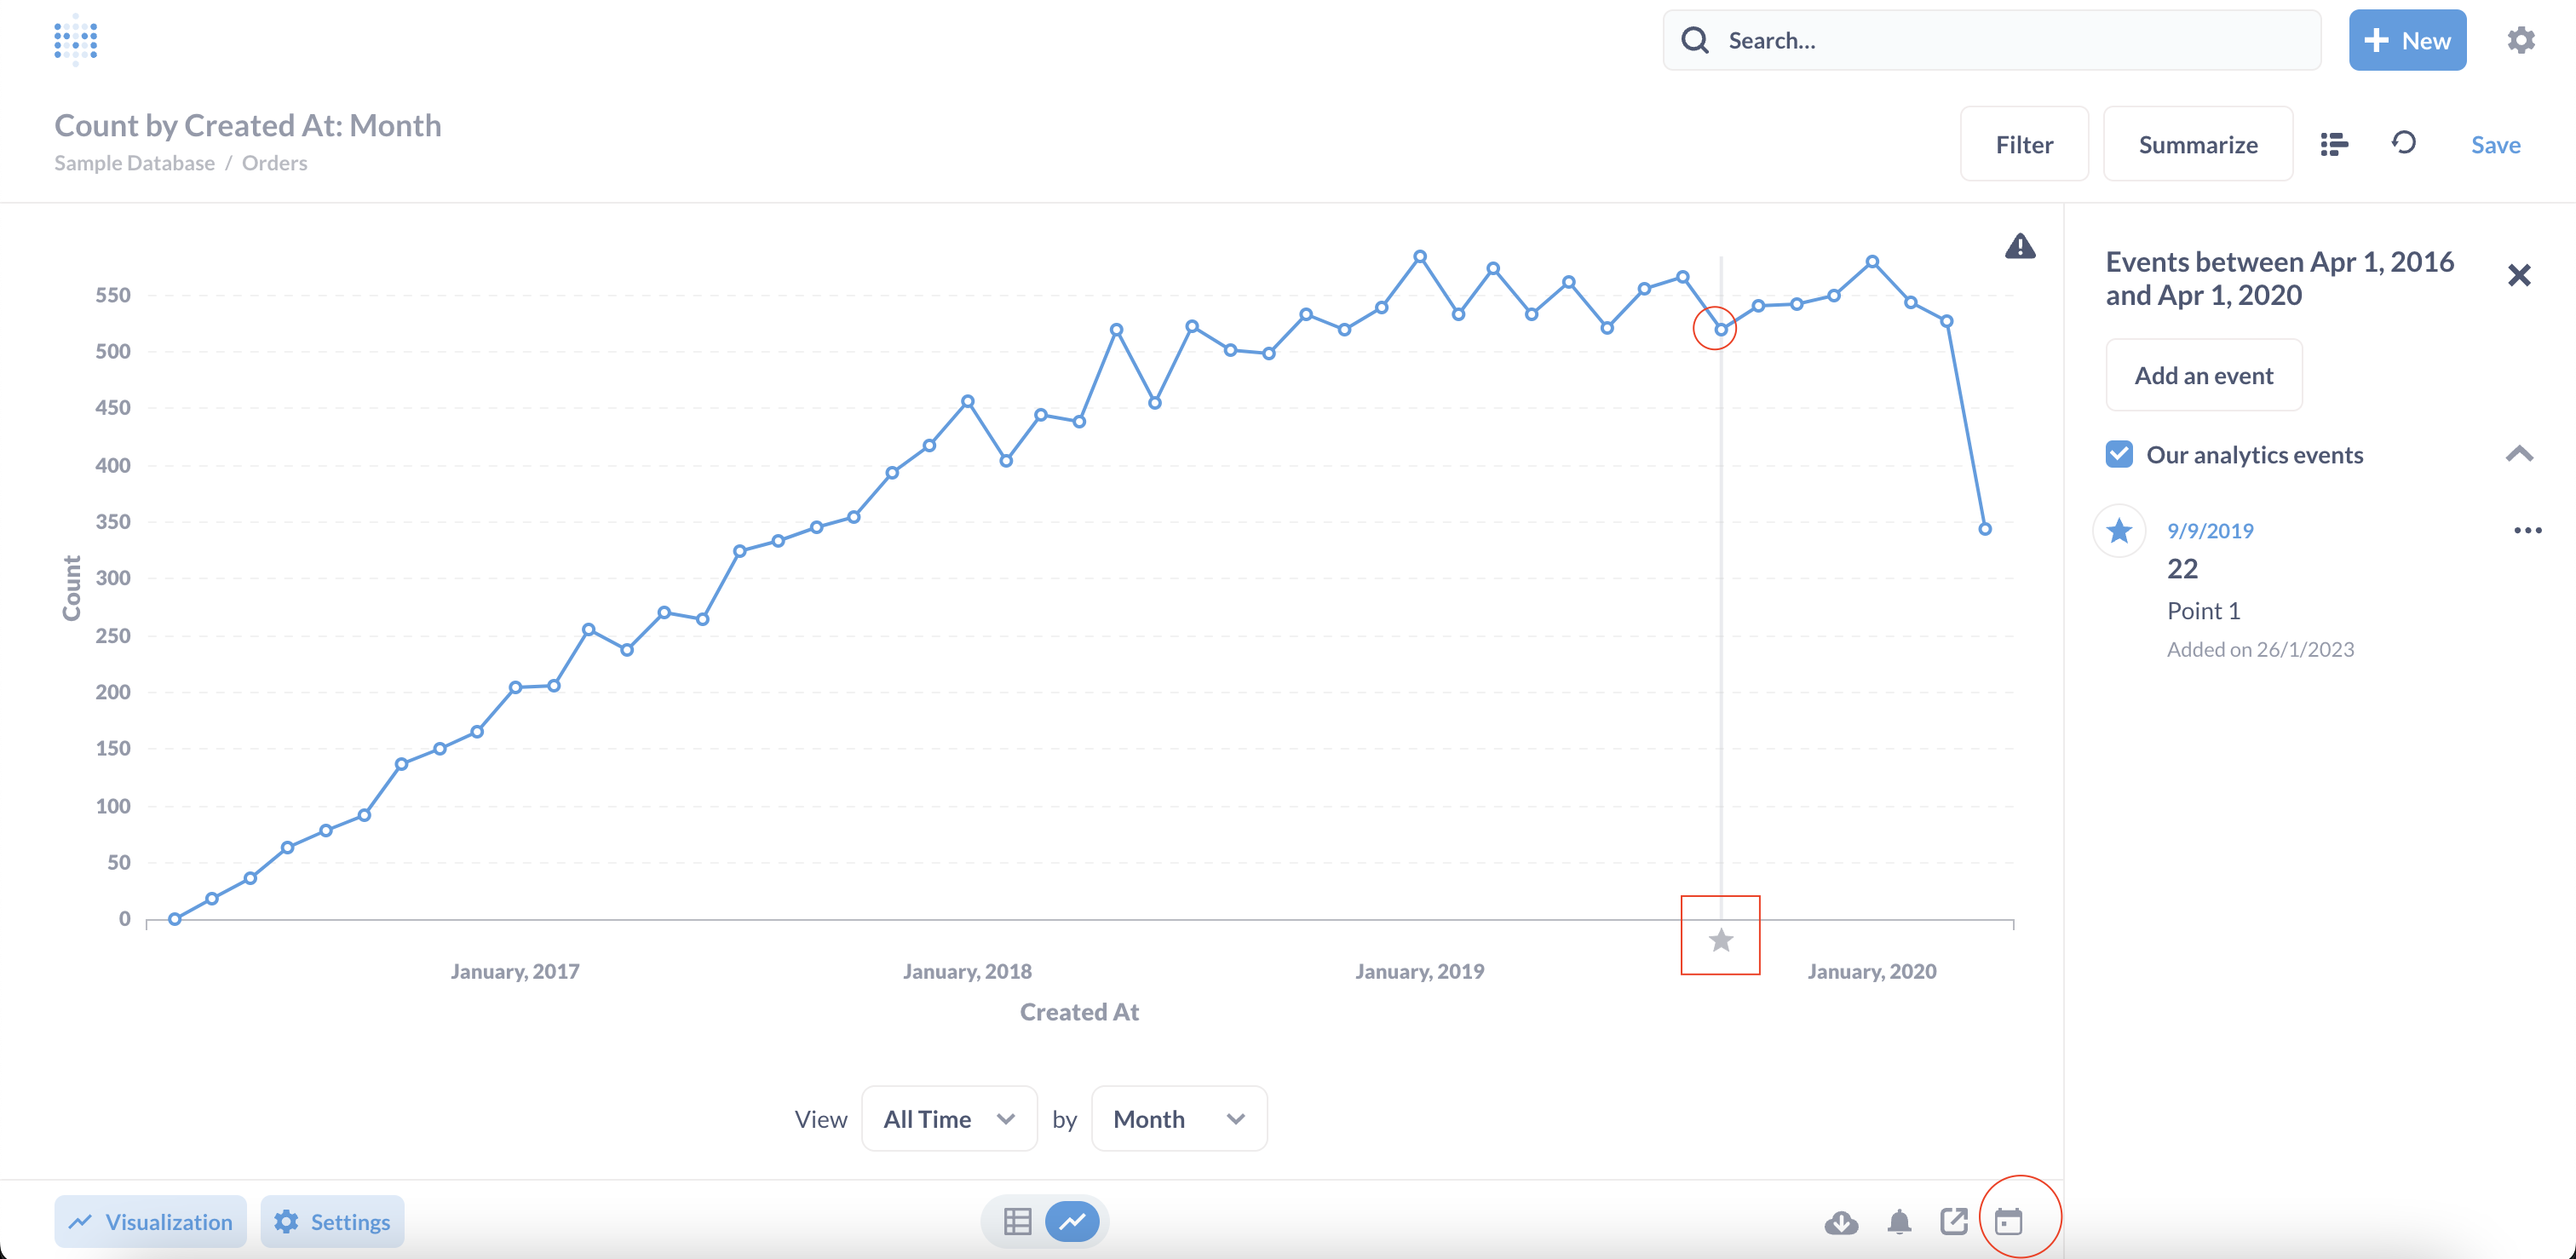
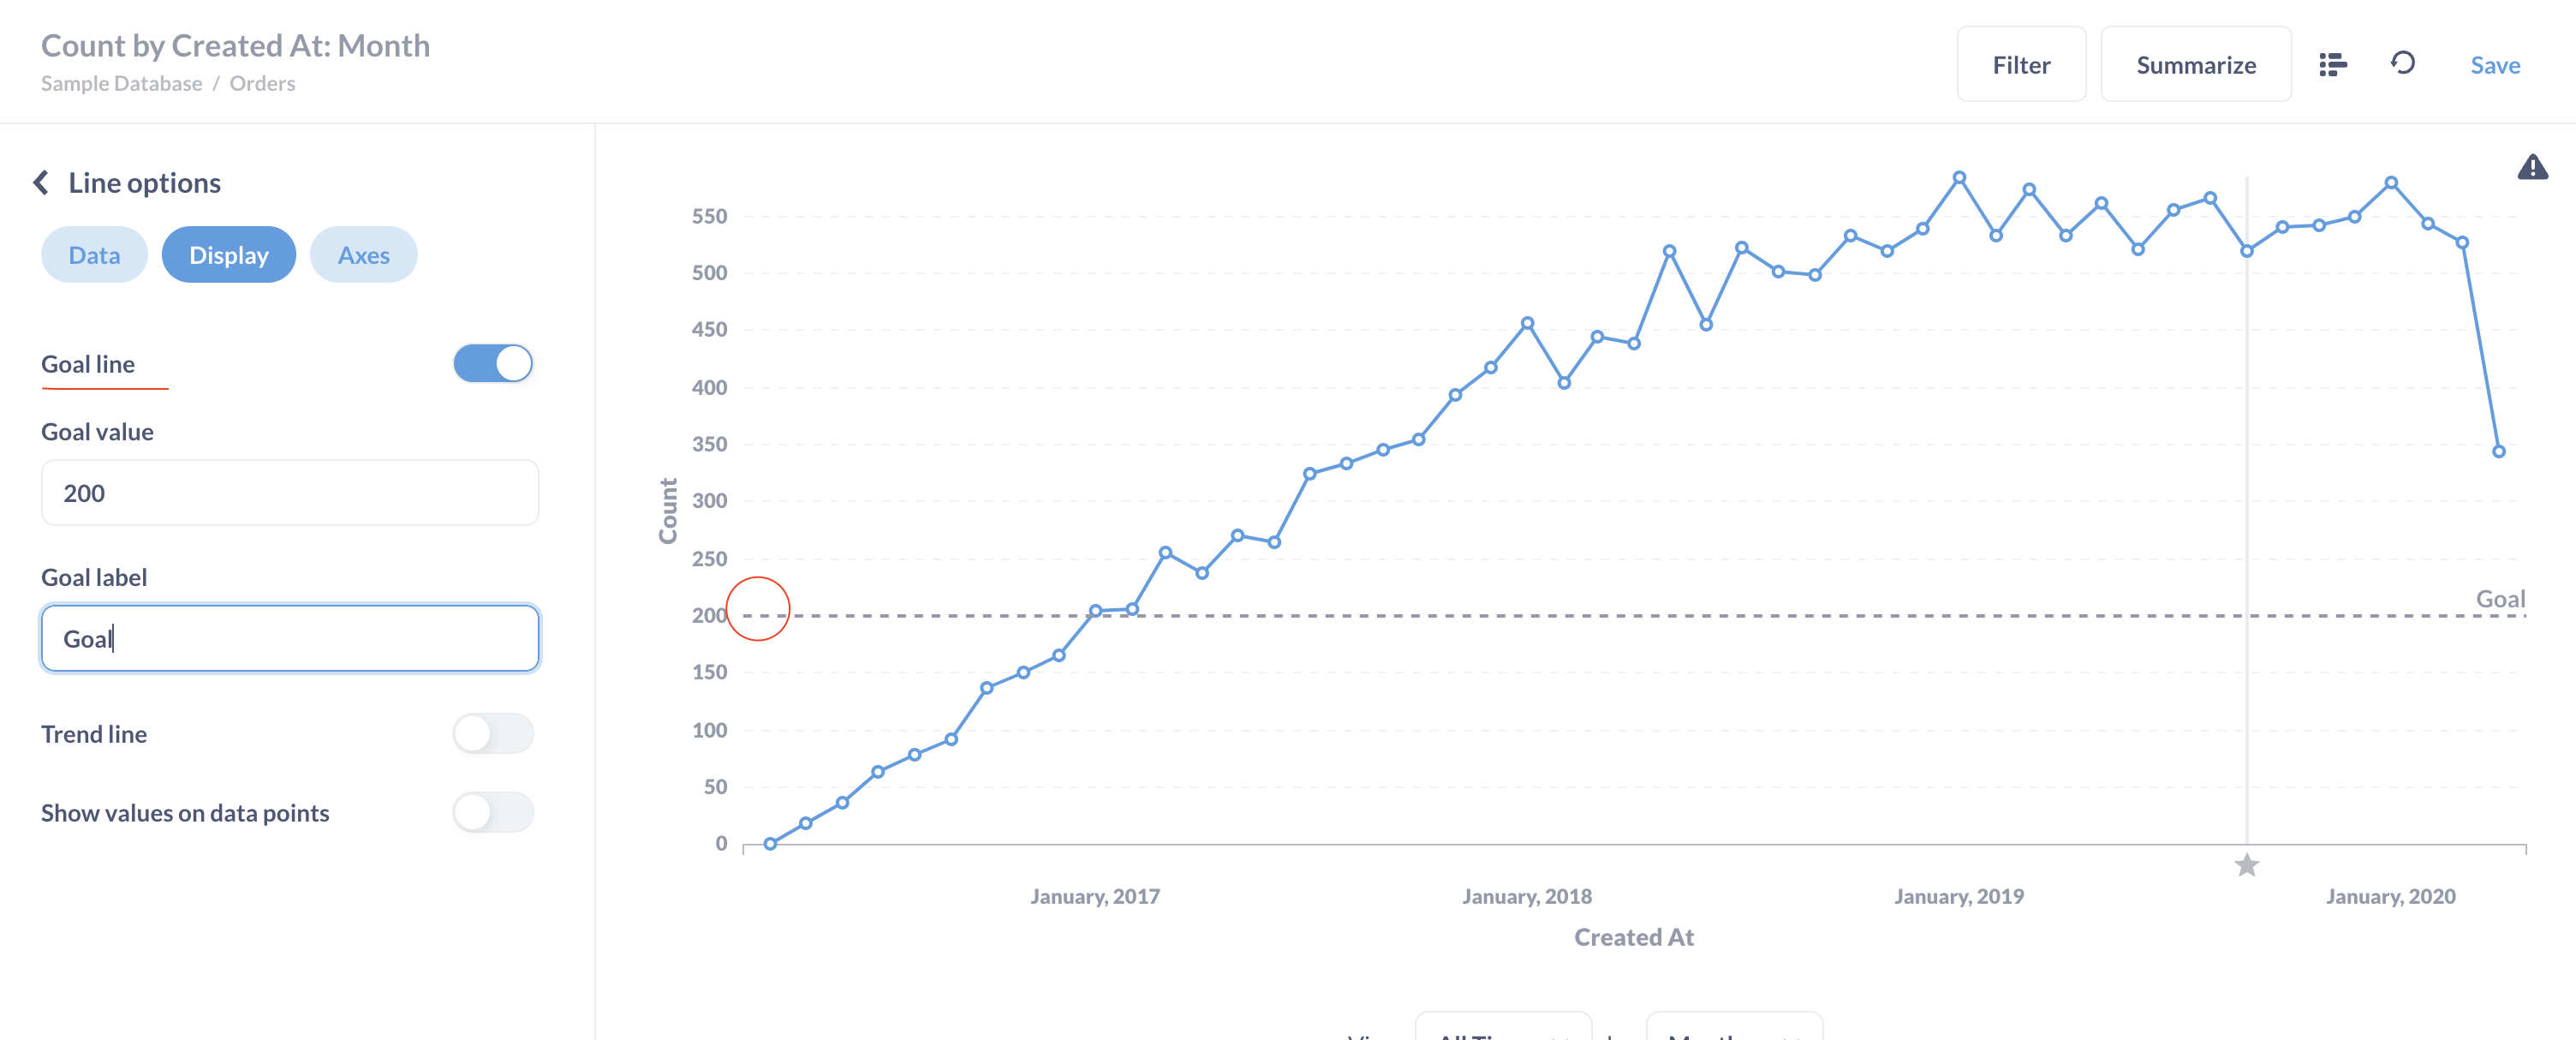
As the title says, i need to put three dots with some data ( in a line like this graphic, is this possible with Metabase? I need a Optimal , Average, and Limit points.
This graphic was made with Plotly.js
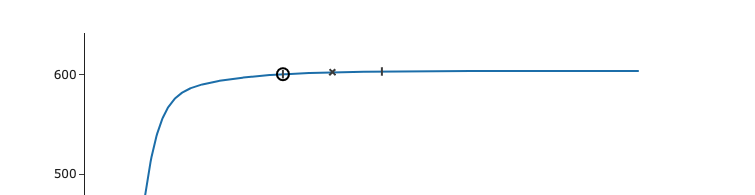
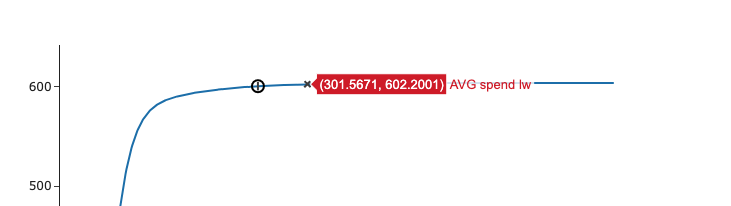

Entire graphic:
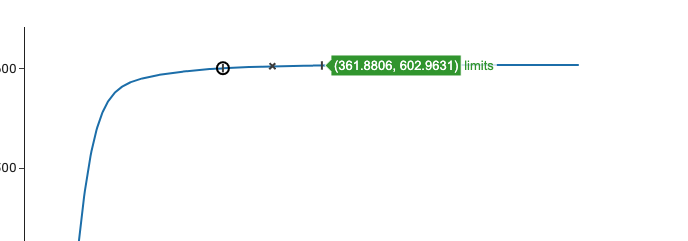
Hi there,
As the title says, i need to put three dots with some data ( in a line like this graphic, is this possible with Metabase? I need a Optimal , Average, and Limit points.
This graphic was made with Plotly.js
Entire graphic: