I want to create a bar graph with a time-series x-axis. When I try to do this with a weekly date granularity with my secondary breakout 'Campaign' set to 'All', I get an empty graph for some reason.
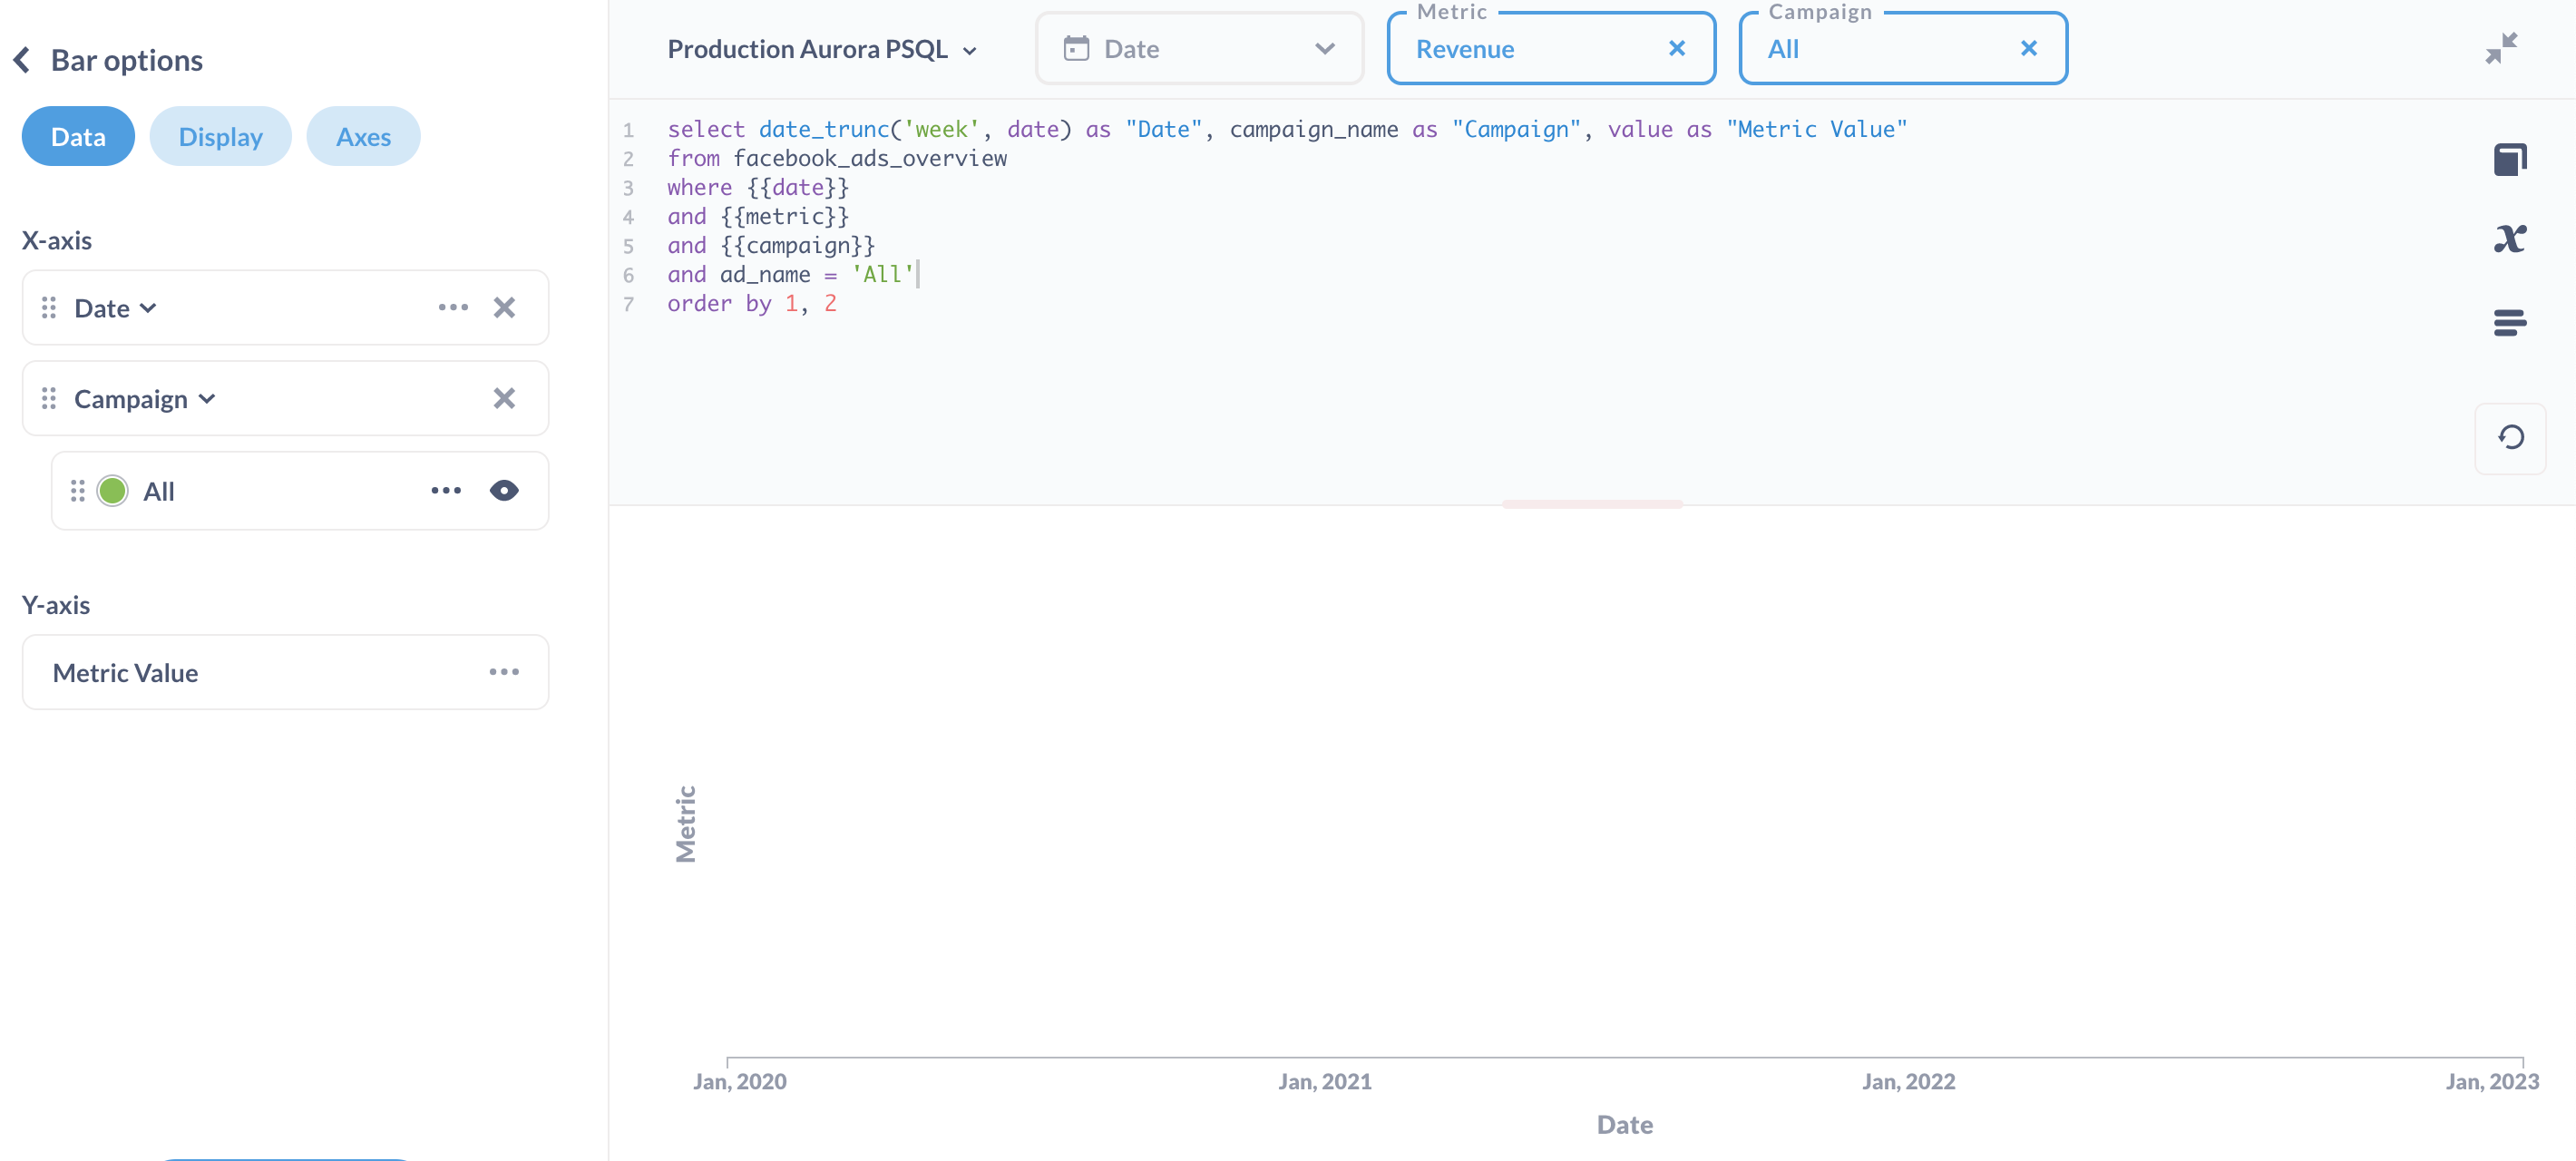
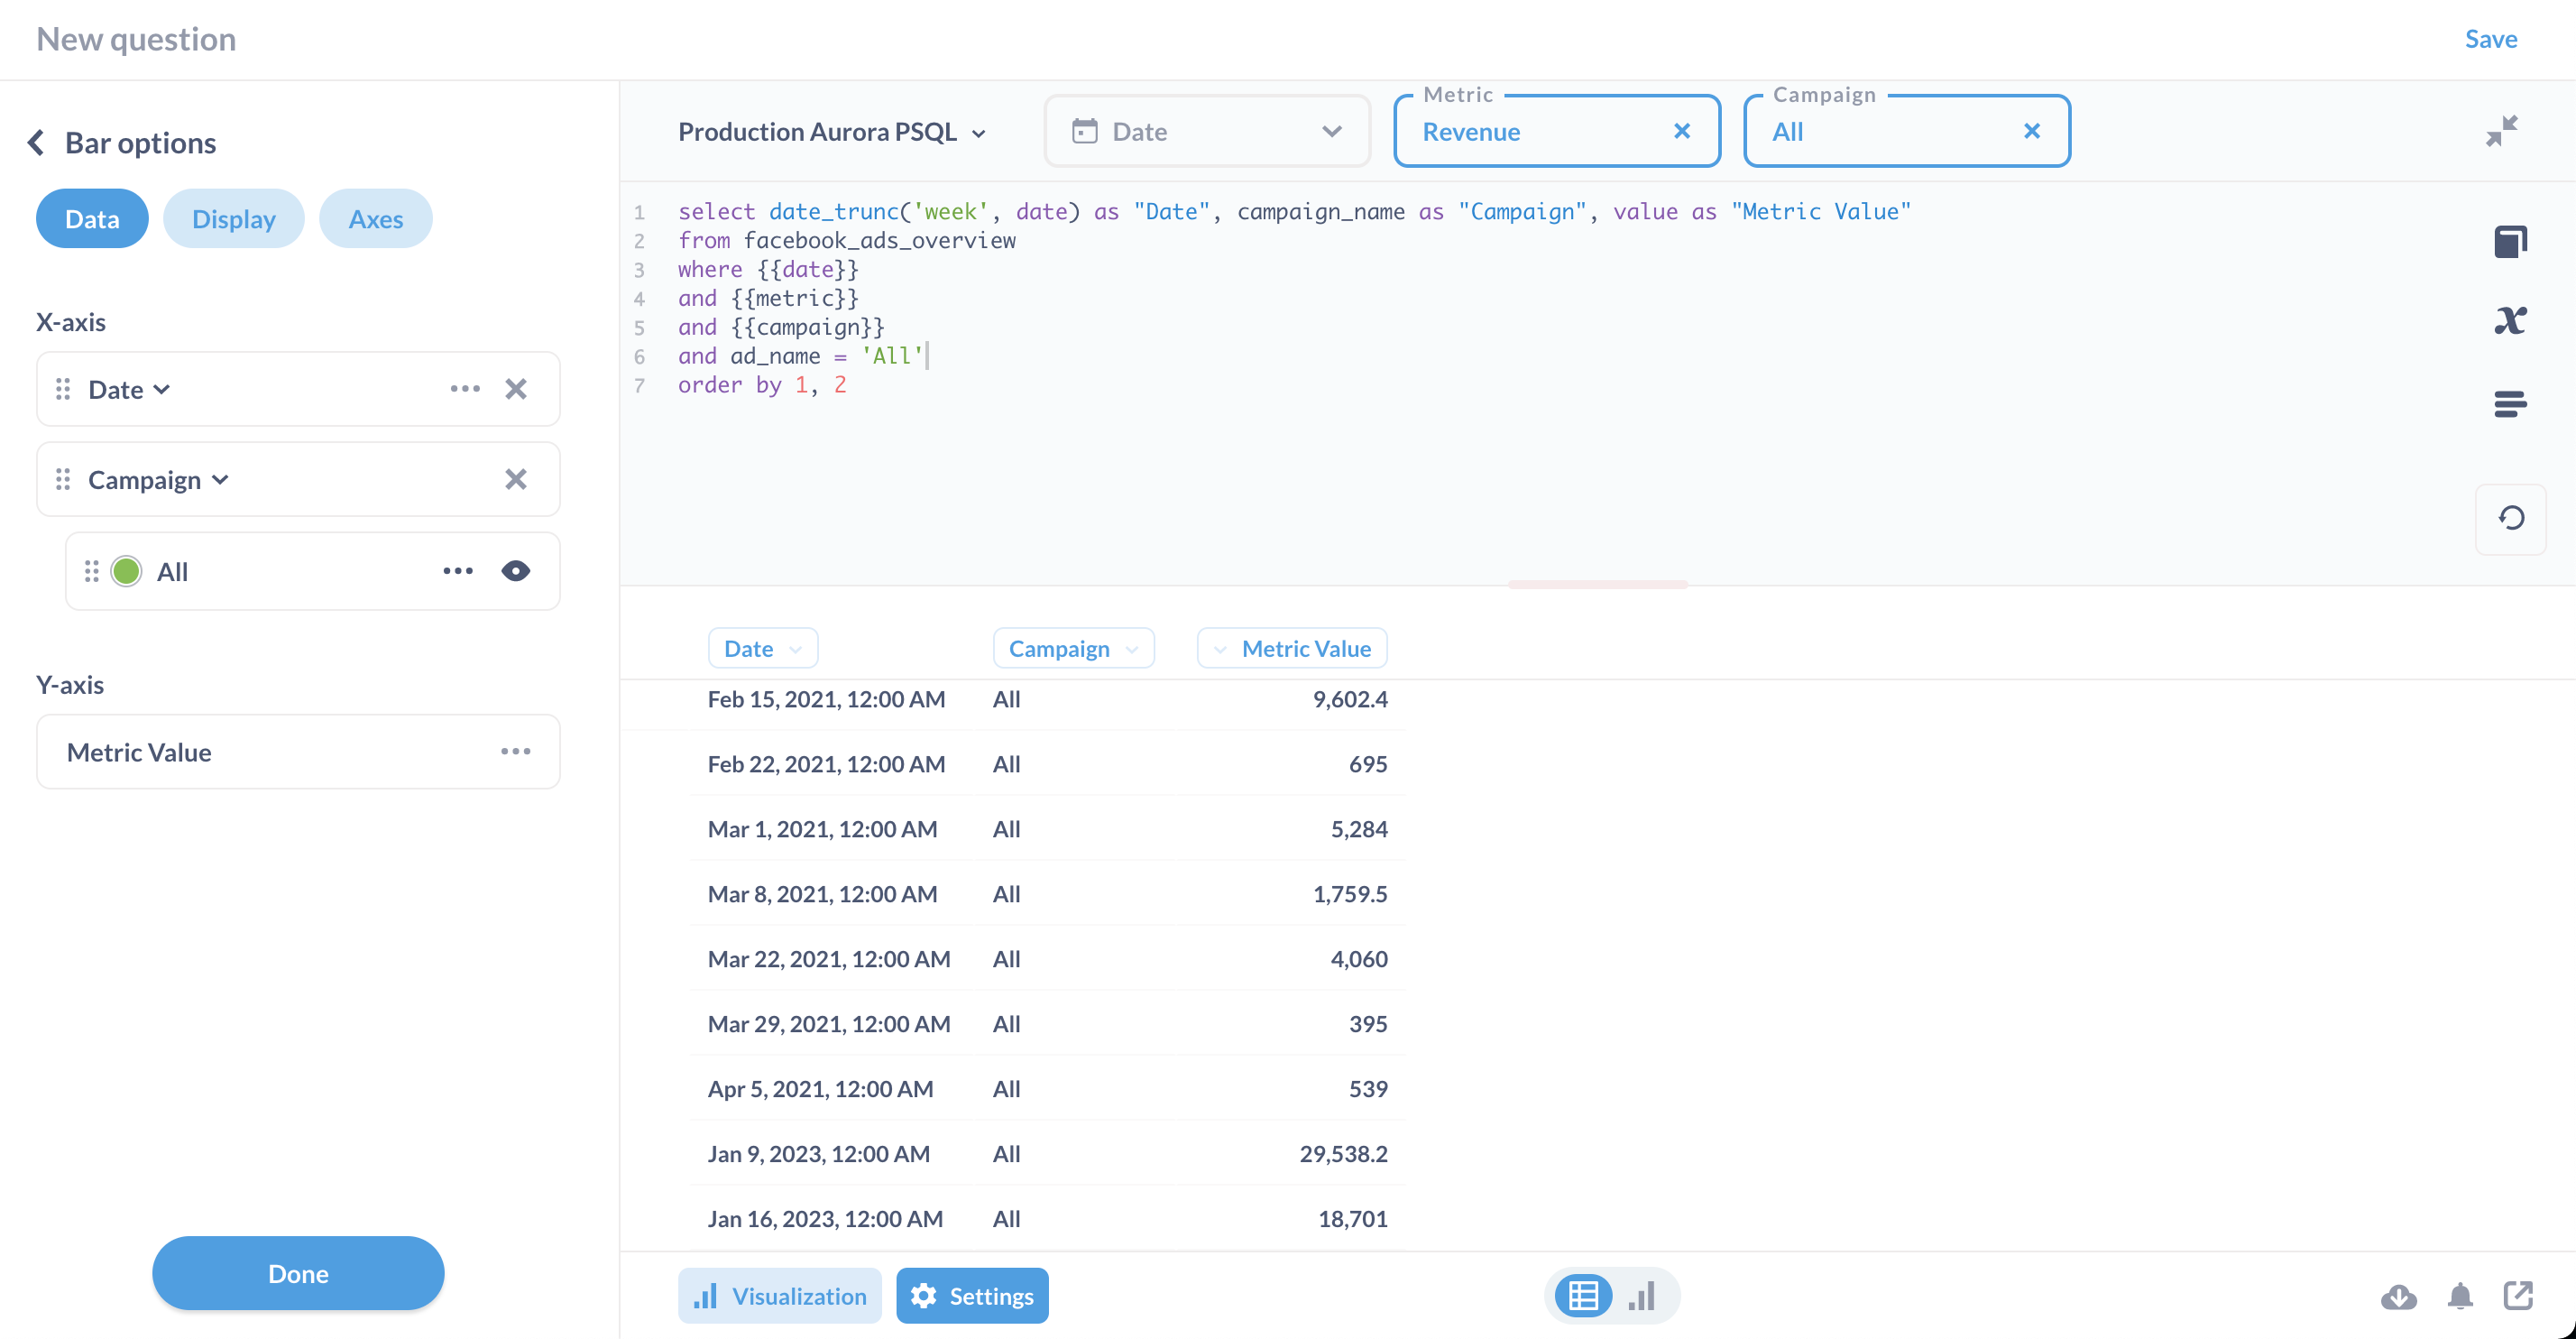
As you can see here, the data itself is there, there's just a problem with the graph.
If I change the date granularity to monthly, it works just fine:

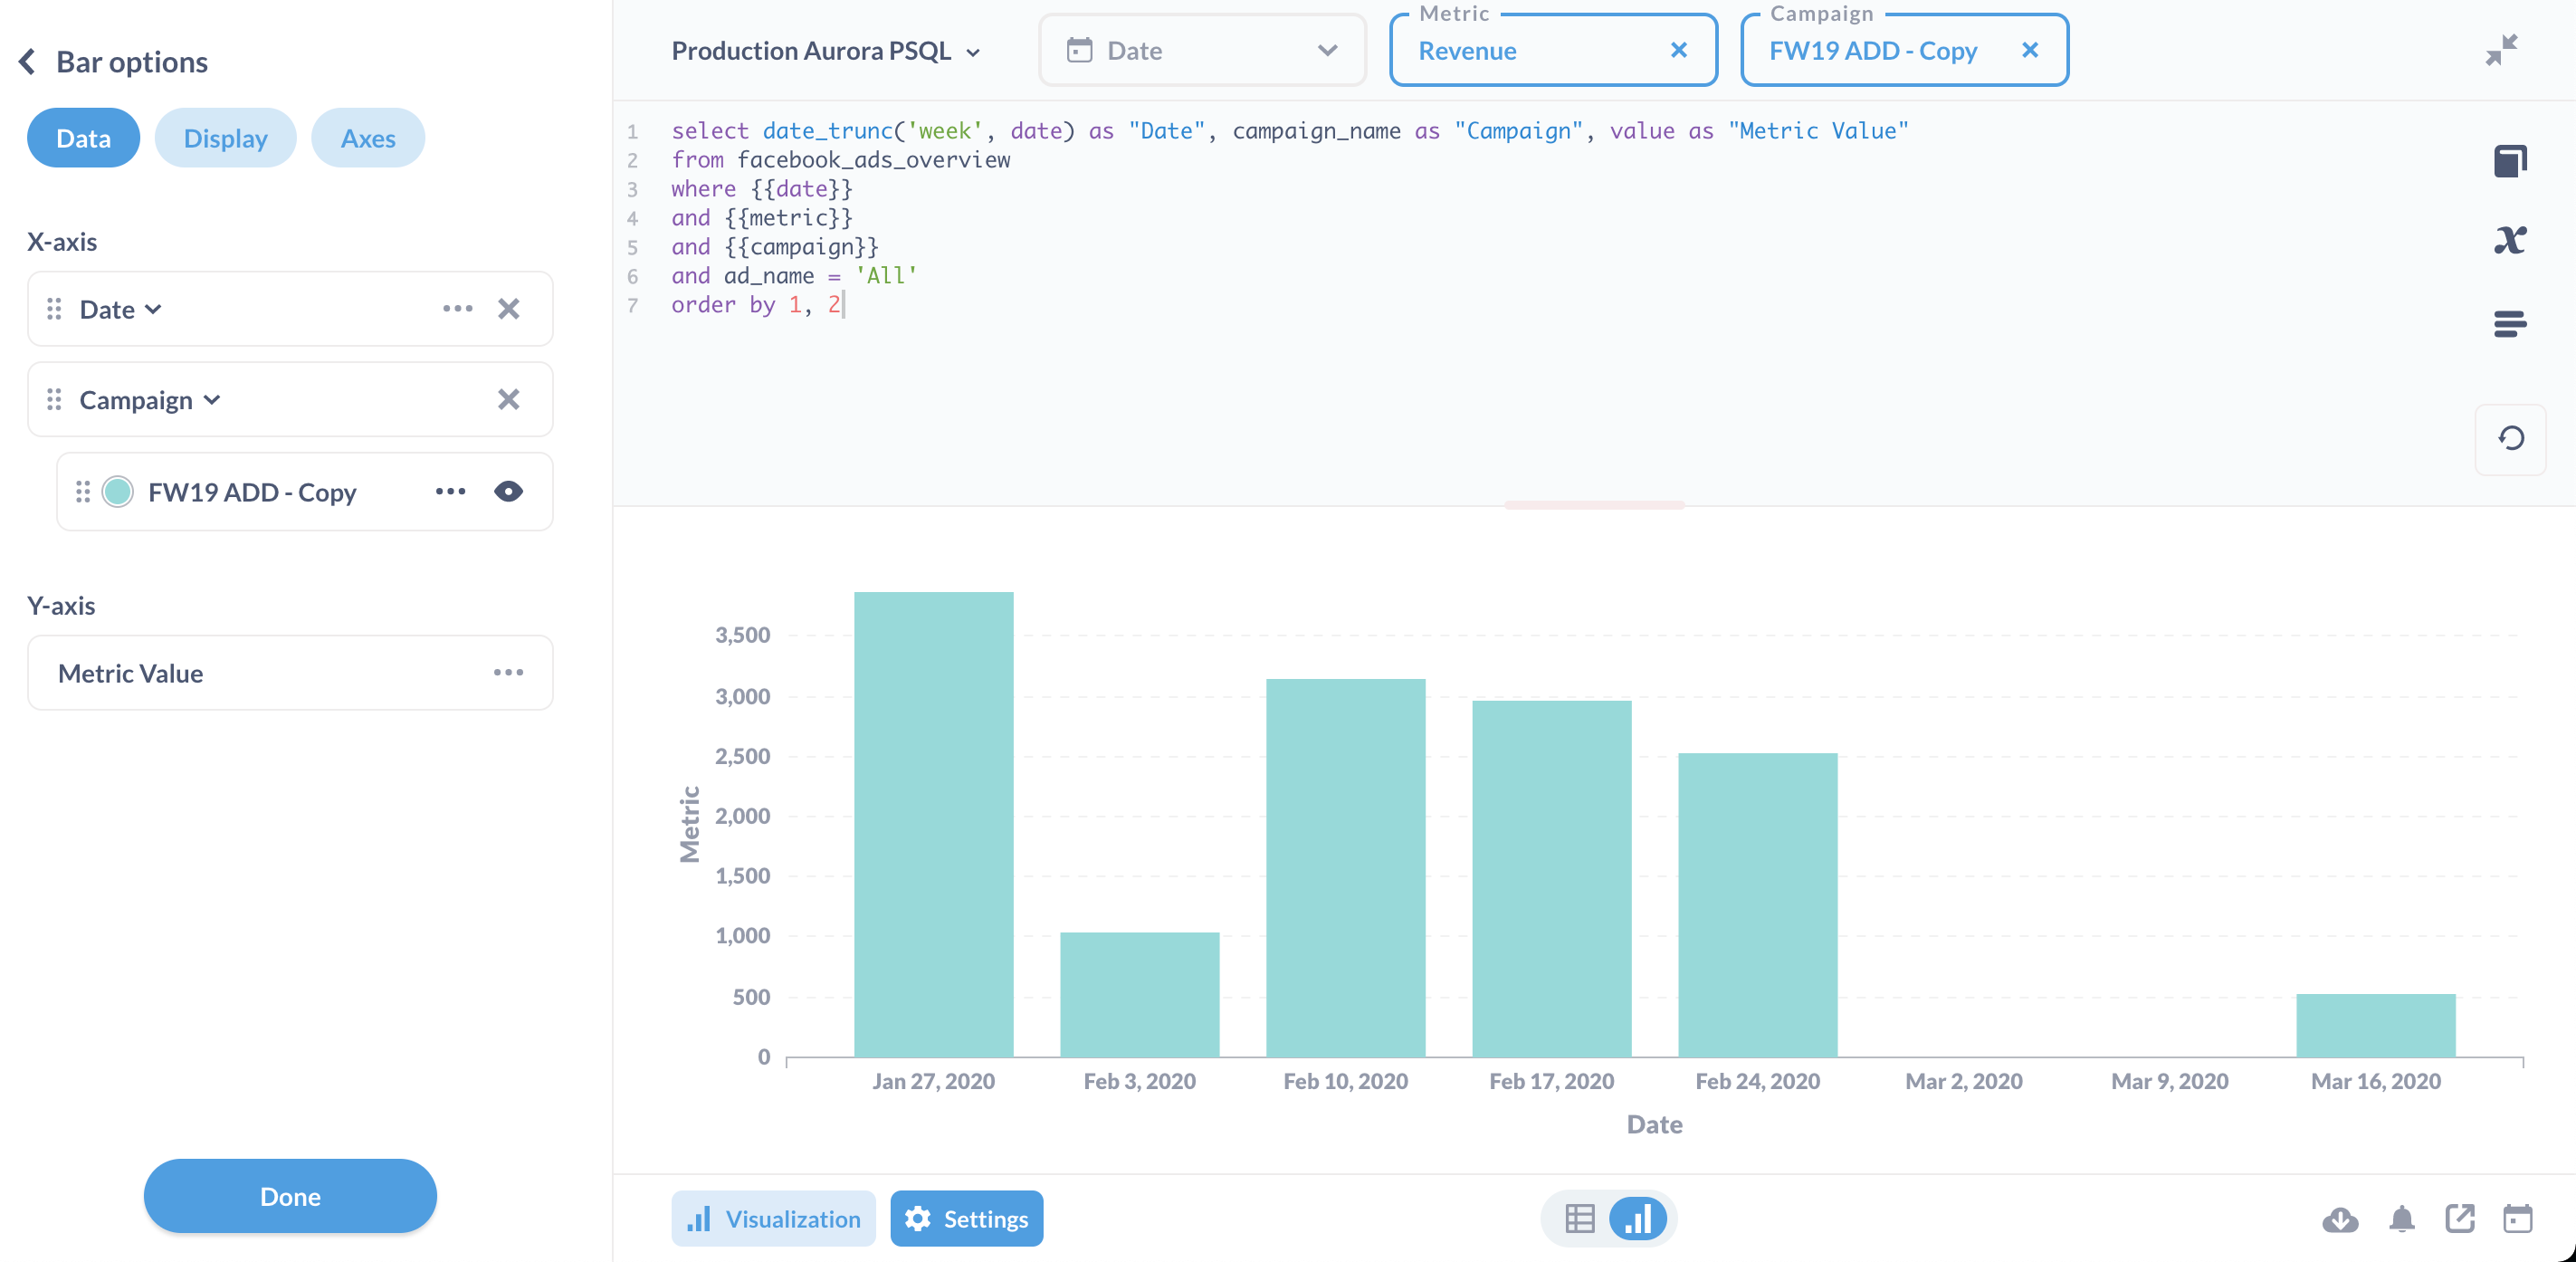
Also, other values for 'Campaign' don't have this issue. It's just the 'All' category:
Diagnostic Info:
{
  "browser-info": {
    "language": "en-US",
    "platform": "MacIntel",
    "userAgent": "Mozilla/5.0 (Macintosh; Intel Mac OS X 10_15_7) AppleWebKit/537.36 (KHTML, like Gecko) Chrome/109.0.0.0 Safari/537.36",
    "vendor": "Google Inc."
  },
  "system-info": {
    "file.encoding": "UTF-8",
    "java.runtime.name": "OpenJDK Runtime Environment",
    "java.runtime.version": "11.0.18+10",
    "java.vendor": "Eclipse Adoptium",
    "java.vendor.url": "https://adoptium.net/",
    "java.version": "11.0.18",
    "java.vm.name": "OpenJDK 64-Bit Server VM",
    "java.vm.version": "11.0.18+10",
    "os.name": "Linux",
    "os.version": "5.4.209-116.367.amzn2.x86_64",
    "user.language": "en",
    "user.timezone": "GMT"
  },
  "metabase-info": {
    "databases": [
      "postgres"
    ],
    "hosting-env": "unknown",
    "application-database": "postgres",
    "application-database-details": {
      "database": {
        "name": "PostgreSQL",
        "version": "11.13"
      },
      "jdbc-driver": {
        "name": "PostgreSQL JDBC Driver",
        "version": "42.5.0"
      }
    },
    "run-mode": "prod",
    "version": {
      "date": "2023-01-18",
      "tag": "v1.45.2.1",
      "branch": "release-x.45.2.x",
      "hash": "3f73d30"
    },
    "settings": {
      "report-timezone": null
    }
  }
}