Hello,
I attached several pictures with my sql question.
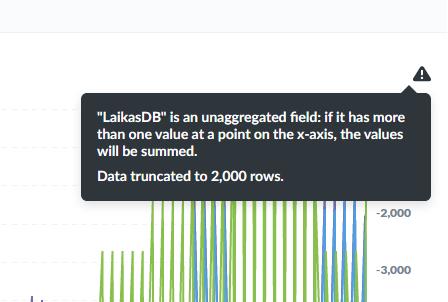
The problem is , is that I need to graph all of my data without summing all of the rows with the same time. How do I go about this?
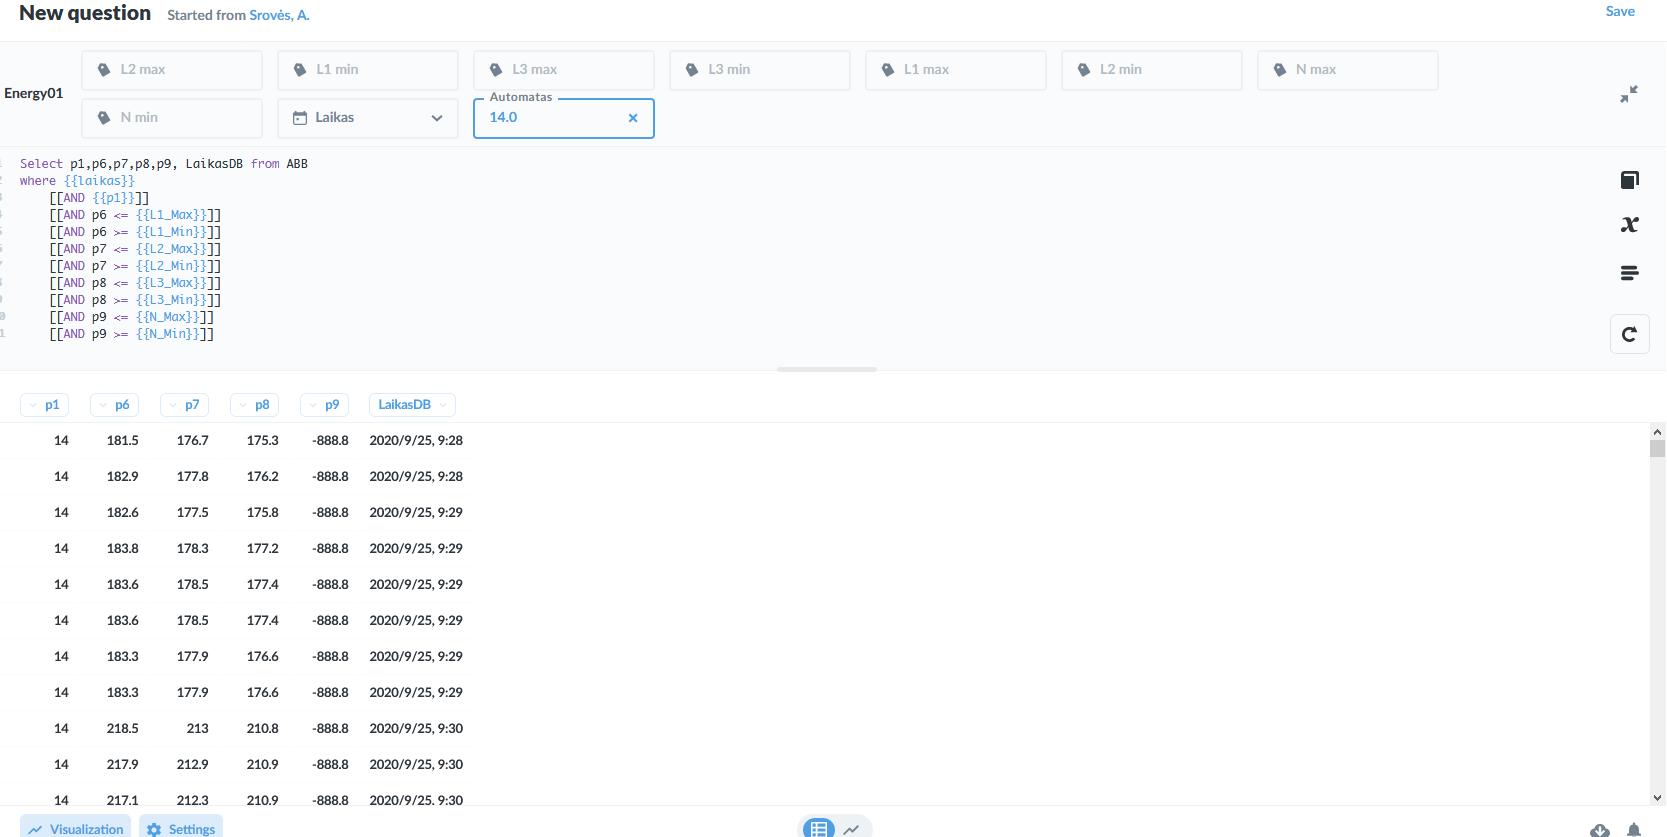
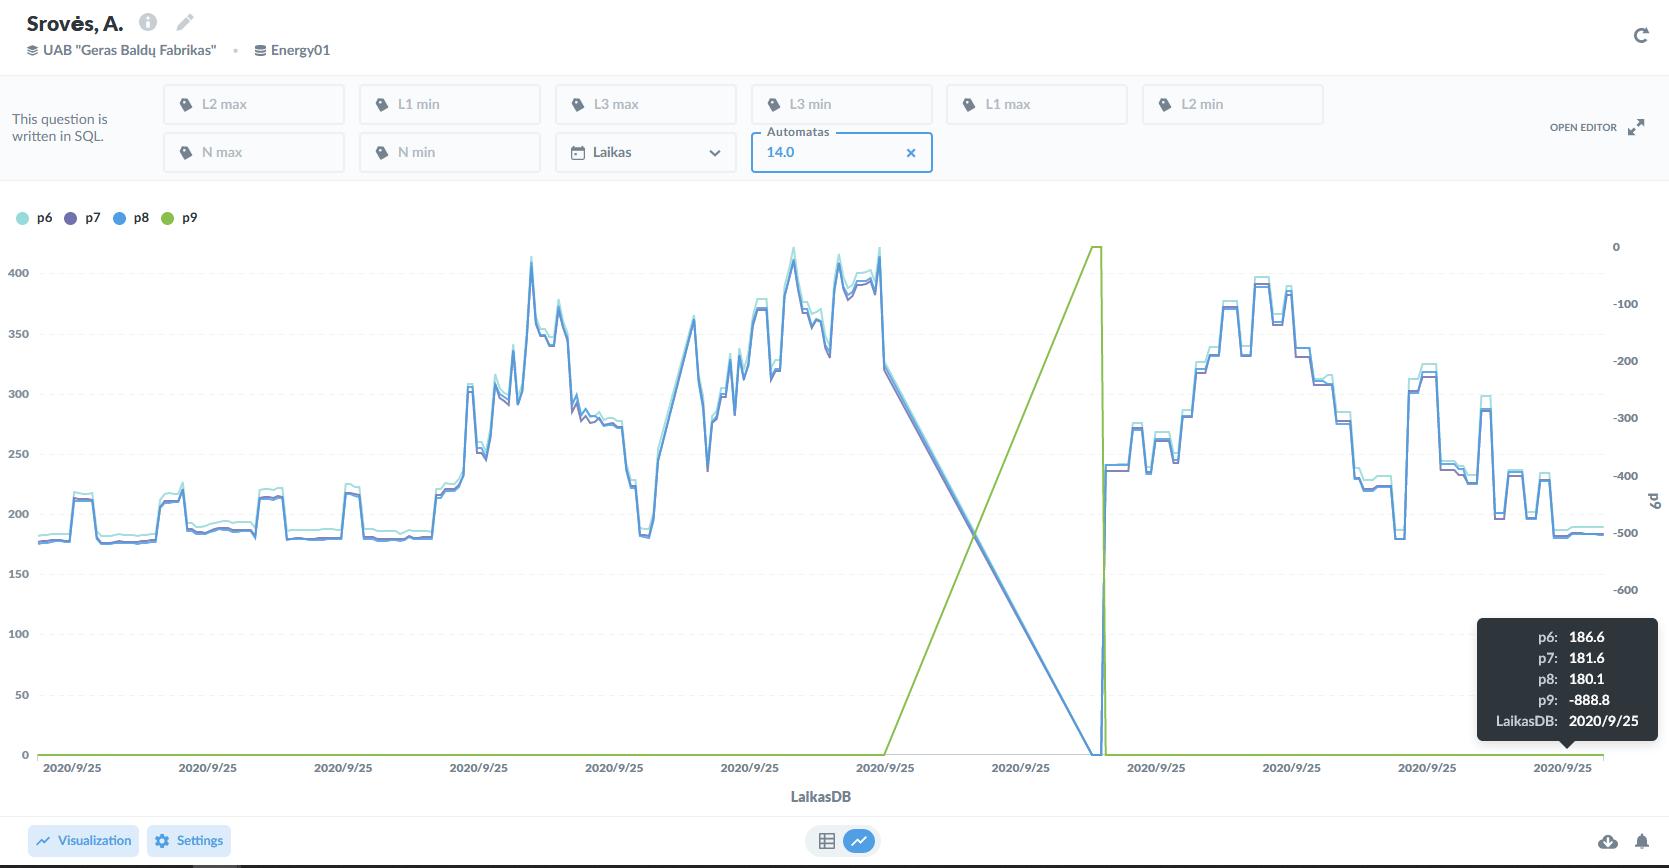
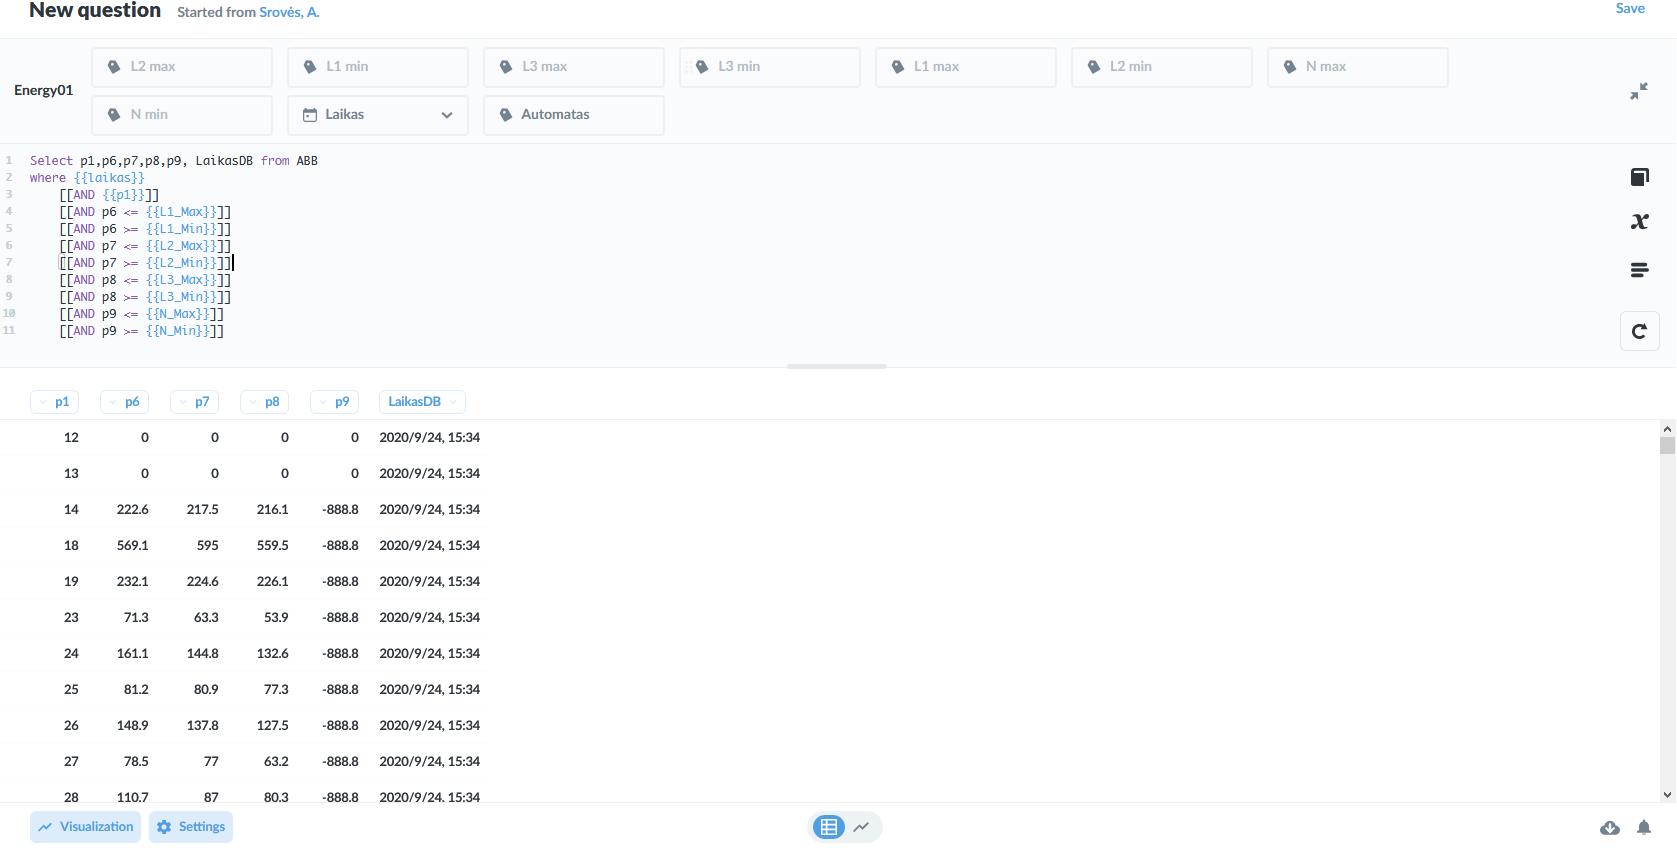
I'm trying to show all of my data grouped by p1 column "Automatas", When im trying to show data where p1 is equal to more than 1 value It sums all values.( if p1= to 1 value then it doesnt sum)
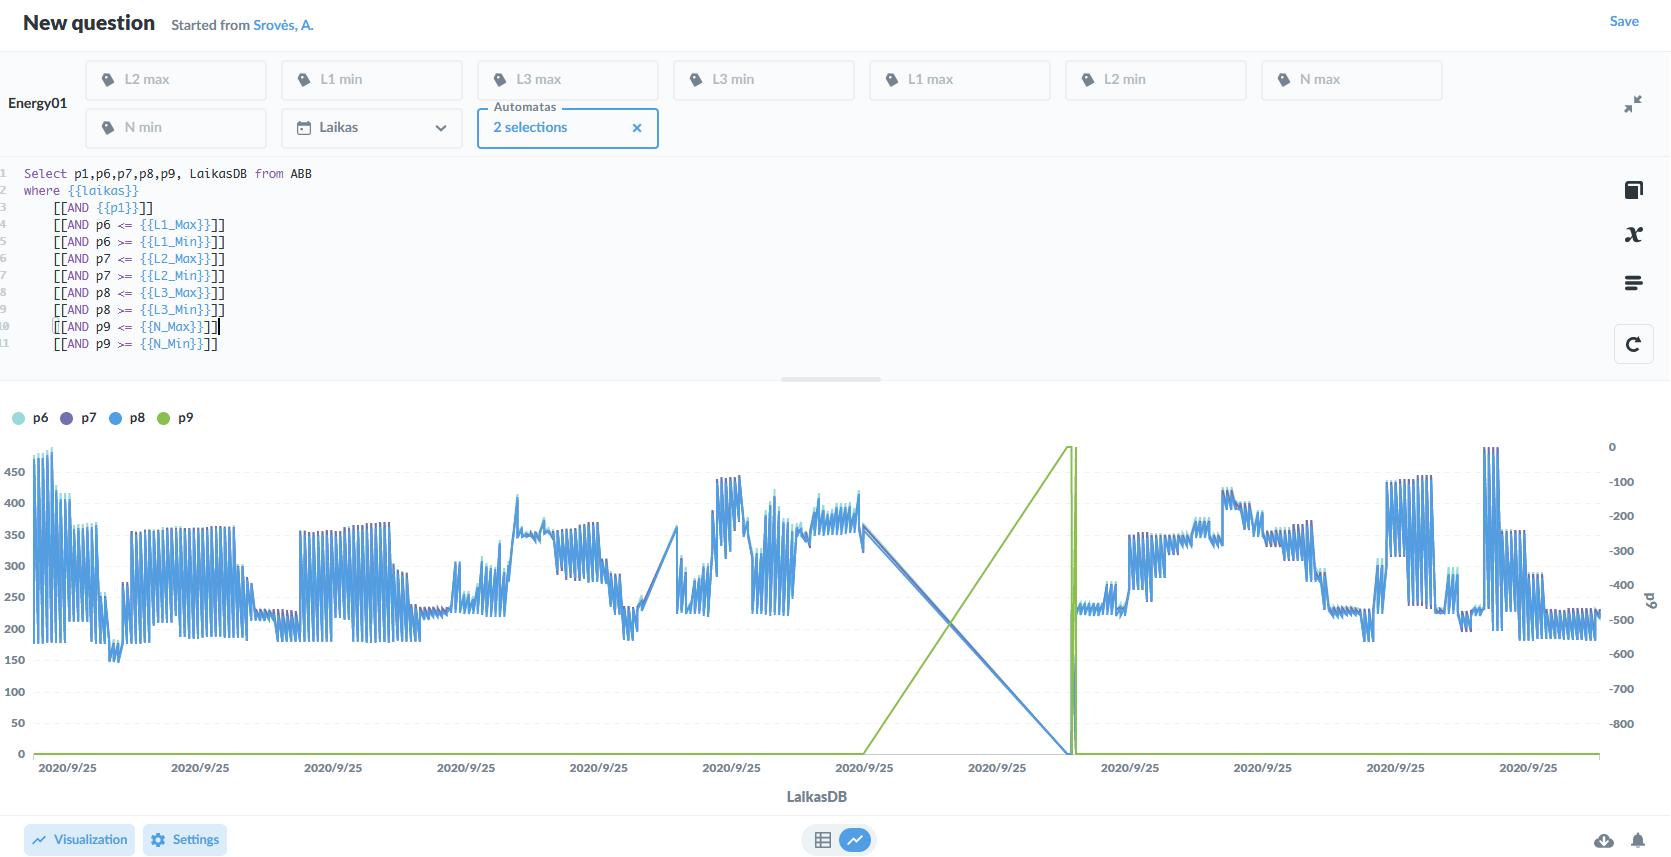
Yes, it's the same issue, The problem now I'm having is that I need to visualize the selected p6,p7,p8,p9 parameters when I filter by my p1 parameter. For example when p1=14;19 it doesnt show me 8 graphs, instead it shows the p6,p7,p8,p9 graphs but somewhat summerised. Should I create seperate questions and combine them or what should I do?
Thank you for your help, Flamber
It’s difficult to completely know what’s the best solution, since only you have access to the data.
But showing this amount of data, at this interval, is probably not Metabase’s strength.

 on the first post