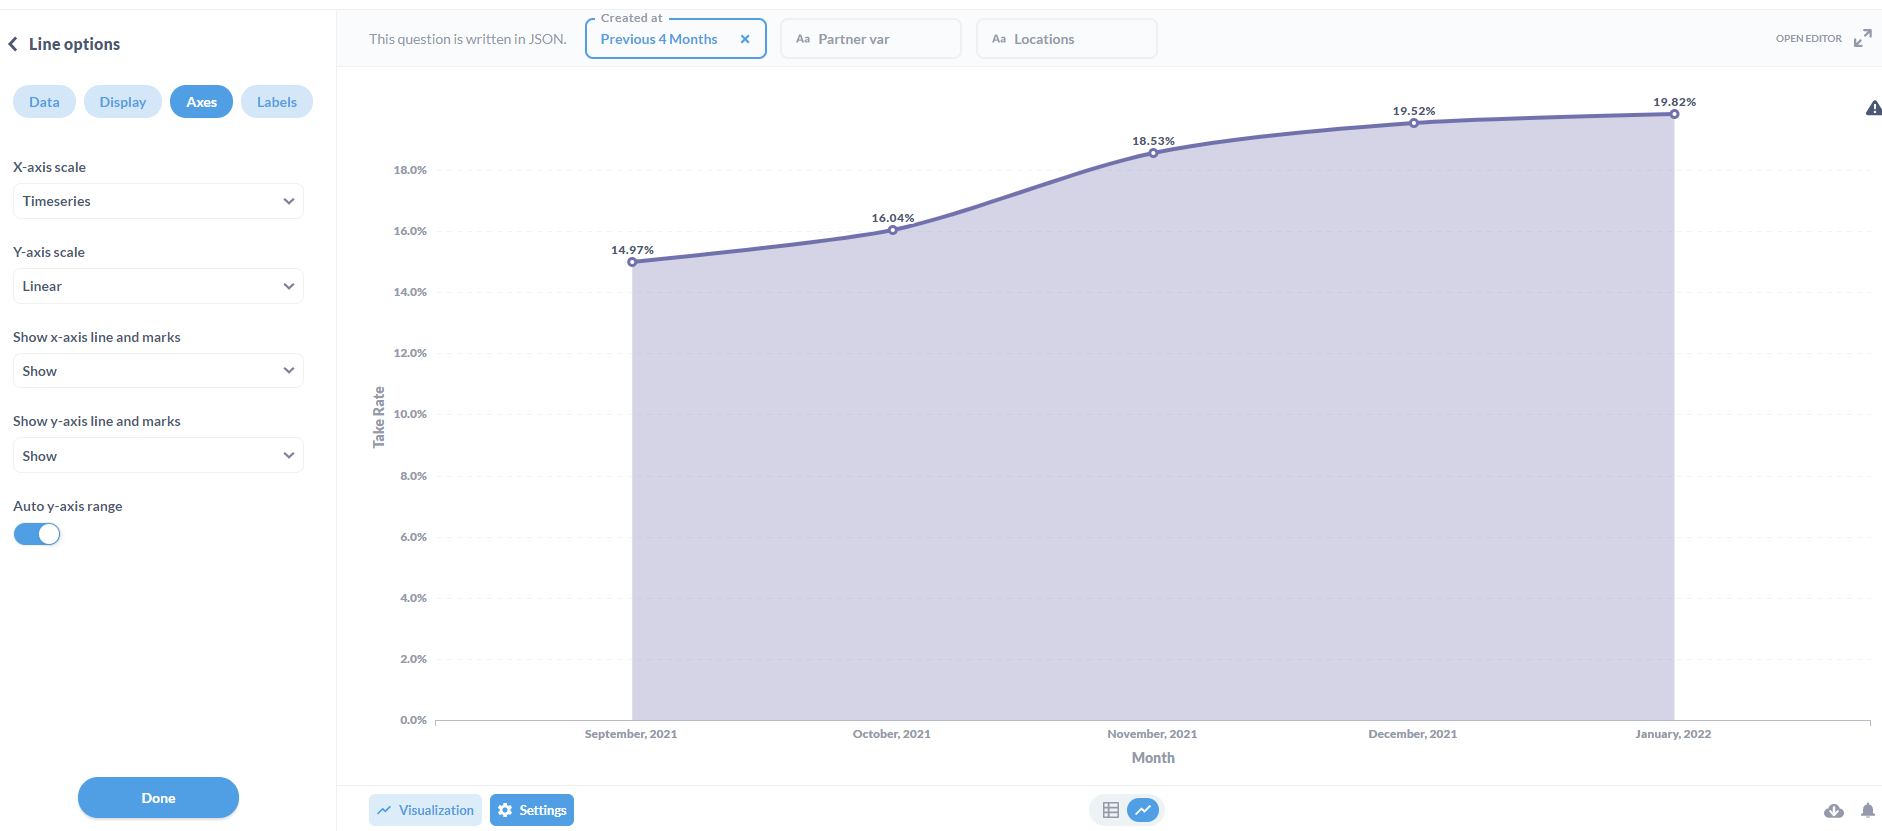
Hi, I've created a line chart displaying some numbers against month.
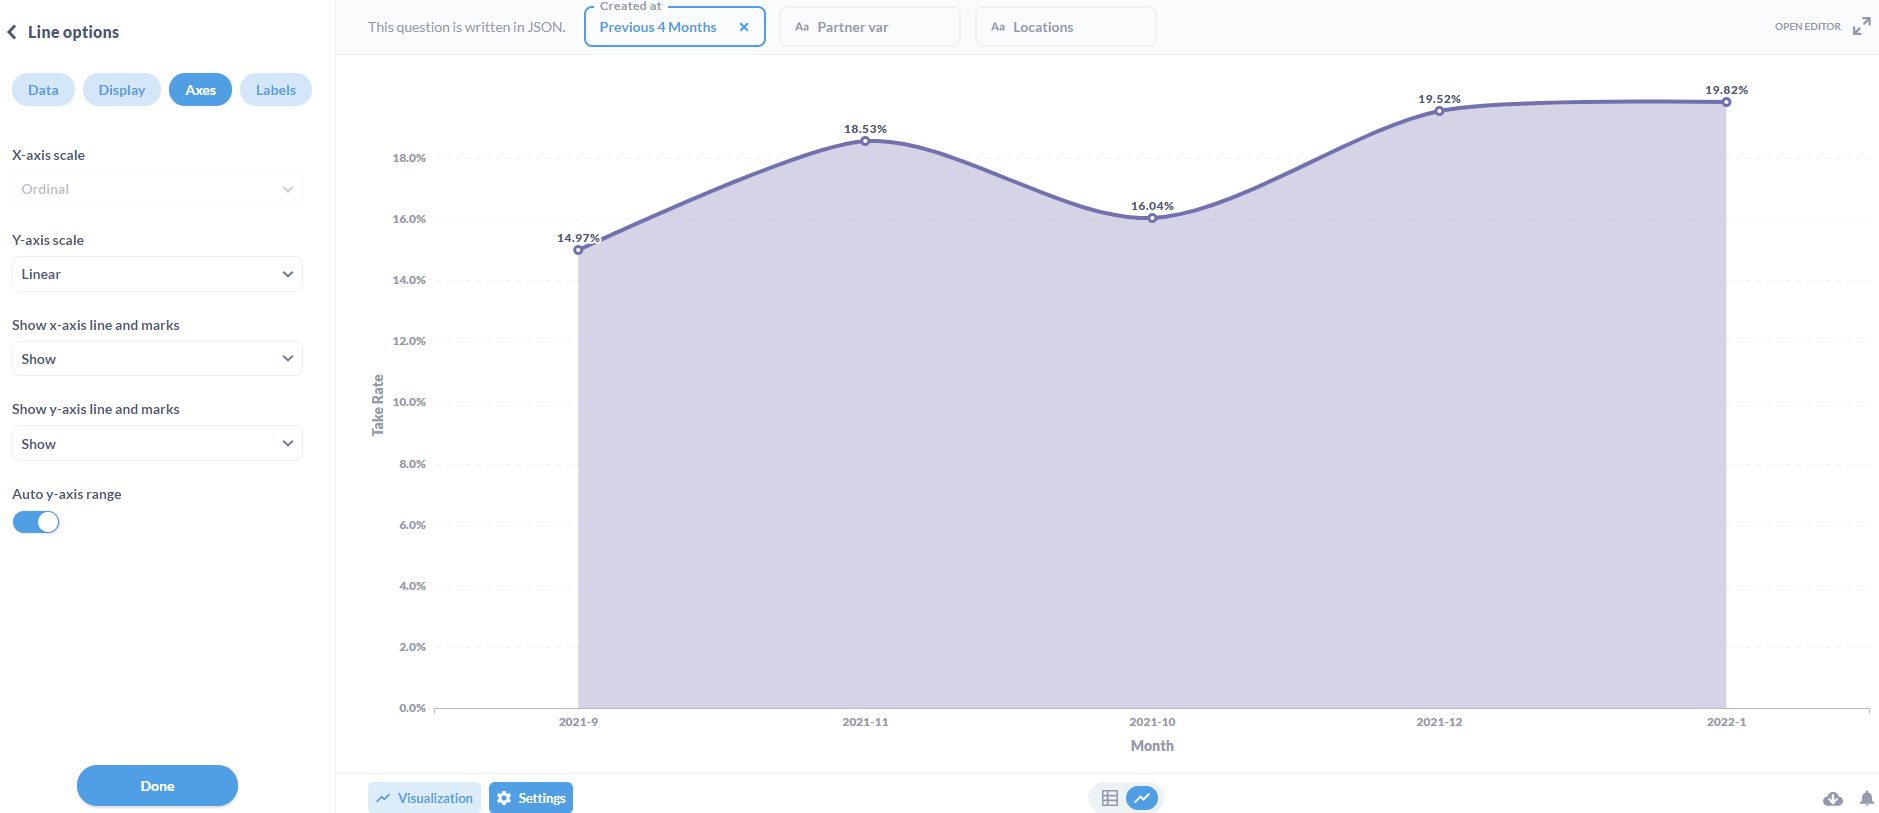
But after every refresh either on the question or dashboard the x-axis seems to mess up. It changes from timeseries to ordinal with no option to change it back to timeseries except by refreshing until its normal again. This issue keeps repeating on 8 other charts with same x-axis but different y-axis.
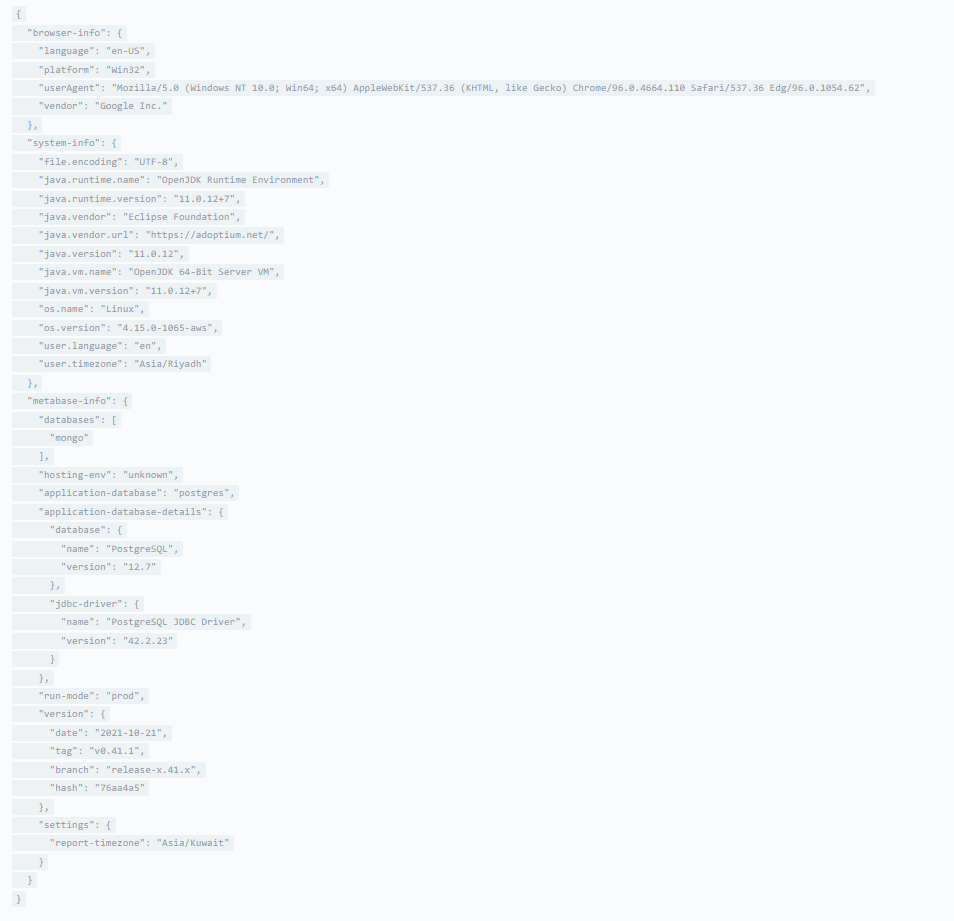
I've attached the images and diagnostic info below.
Am I doing something wrong?
Hi @shahmirali
You should upgrade to latest release: https://github.com/metabase/metabase/releases/latest
And without knowing what you are returning, then it's difficult to know, but there are some known issues with MongoDB and the time format it's supposed to return, which causes strange problems, example:
https://github.com/metabase/metabase/issues/16170
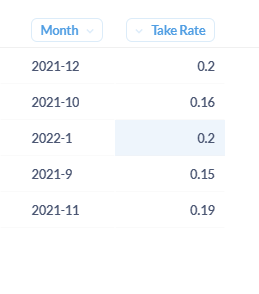
Basically this is the result of my query where I $group the data by year and month and use concatenation on the $project stage to display year - month.
Then I change the visualization to line chart. It initially displays a correct chart but after a reload it messes up.
@shahmirali Please provide the query, so I can try to reproduce.
{
    "$match":{
            {{created_at}},
    }

},
{
    "$group":{
        "_id":
        {
            "monthly": {"$month": {"date": "$startTime", "timezone": "Asia/Riyadh"}},
            "yearly": {"$year": {"date": "$startTime", "timezone": "Asia/Riyadh"}},
        }
        "gmv":{"$sum":"$payment.totalPartnerInvoicing"},
        "gp": {"$sum":"$payment.grossProfit"}
    }
},
{
    "$project":{
        "_id": 0,
        "Month": { "$concat":[ {"$toString": "$_id.yearly" }, "-" {"$toString": "$_id.monthly" } ] }
        "Take Rate": {"$divide": ["$gp","$gmv"]}
    }
}
@shahmirali Try returning a date format, so Metabase can understand it's a timeseries.
I was able to solve this issue. The issue was that the query was returning dates but in random unsorted order which created the issue.
I sorted the query on the Month column in the end, thus returning correct x-axis.