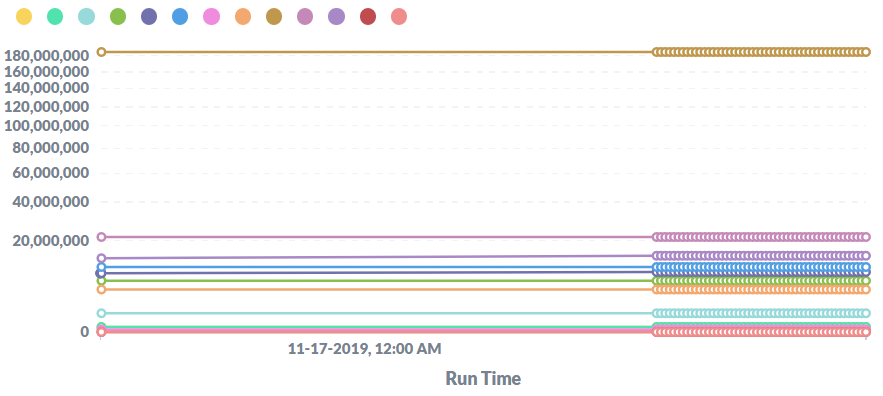
Is there any way where I can include more labels Run time on X axis in a timeseries? Currently it shows only one time as you can see in the image below.
Hi @kjkrupal
Yes, change the X-scale style from Timeseries to Ordinal in visualization Settings > Axes.
There’s work being done, so Timeseries shows more ticks - might arrive in 0.34.0:
https://github.com/metabase/metabase/issues/11158 - upvote by clicking  on the first post
I have a lot of values so ordinal will be a bad option. When would you release 0.34?
@kjkrupal I don’t know. Perhaps this year.
Okay thank you!
0.34 is currently scheduled for early to mid December.
Hi @maz, Will this release also contain support for more than 20 series in a chart?