Hello,
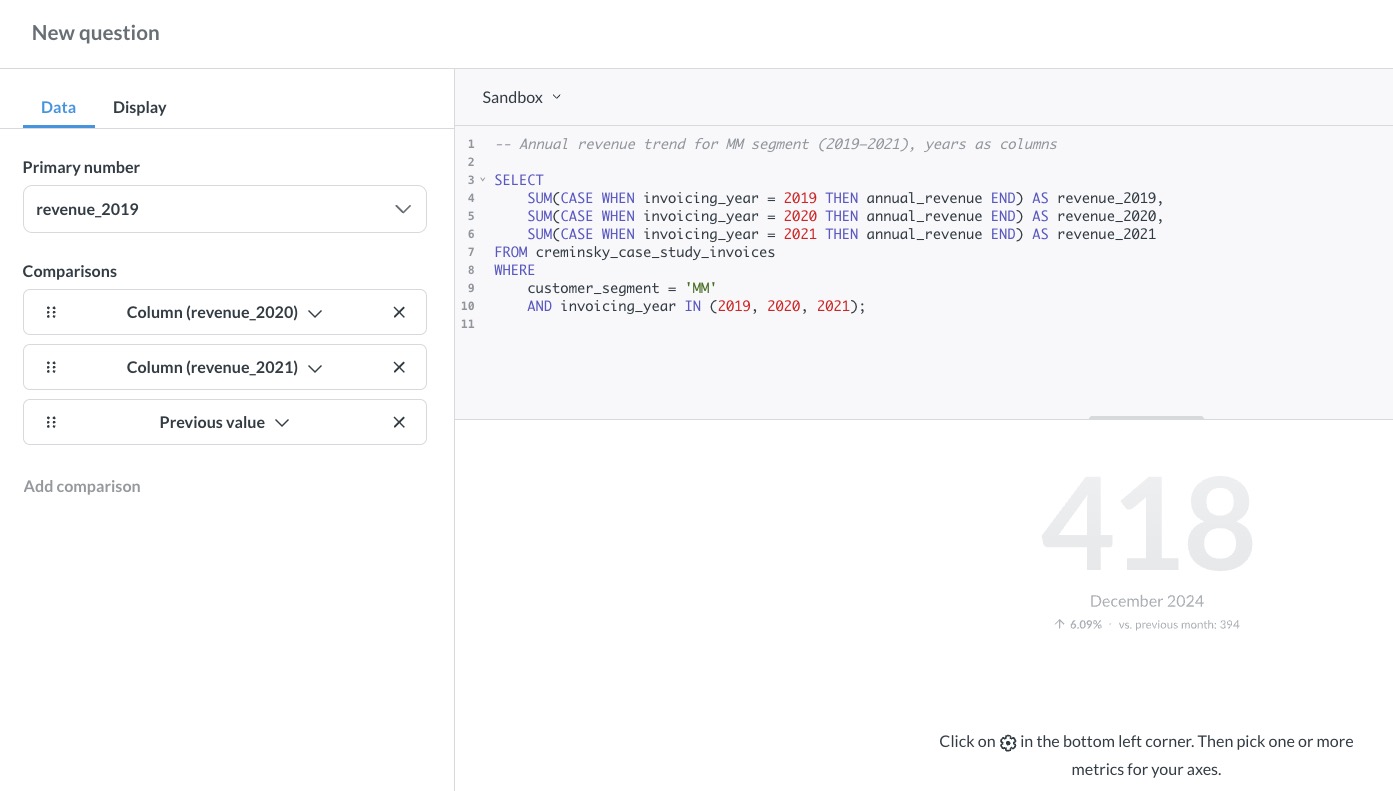
I’m confused as to who the data must be structured to use the Trend chart properly. I’d like to display a Revenue number like in the example Trend | Metabase Documentation and compare with the previous year, and the year before that.
- Do I need to have one year per column?
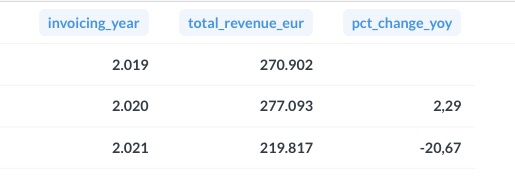
- Do I need to compute the % increase/decrease in SQL?
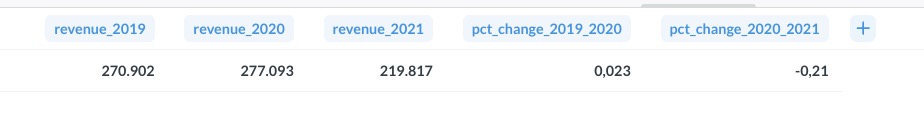
Below are dummy data.
Is this the format to have?
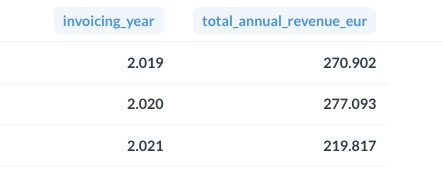
Is this the format to have?
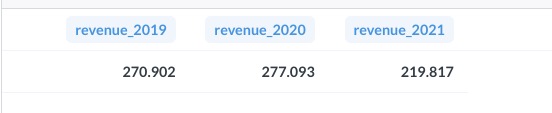
Is this the format to have?
Is this the format to have?