Trend visualization group by year + another non-time criteria

Hi,

I'm new to Metabase, and I'm struggling with the following issue : I have a MongoDB collection that contains (among others) : locality, date, amount.
I would like to display a table with, for each locality, the sum of amount for the current year, for the previous year, and then the trend (in %) between the 2 years.

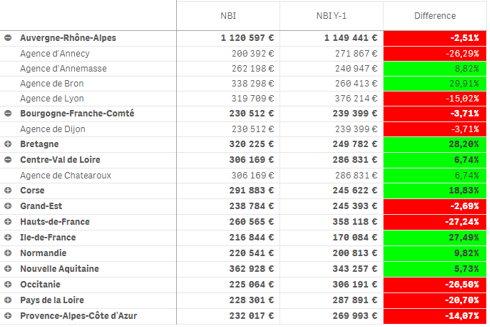
Here's a mockup of what I would like to have. 2° column is the locality, 2° column is the sum of amount for current year, 3° column is the sum of amount for previous year, and the last column is the trend between the 2 years.
image

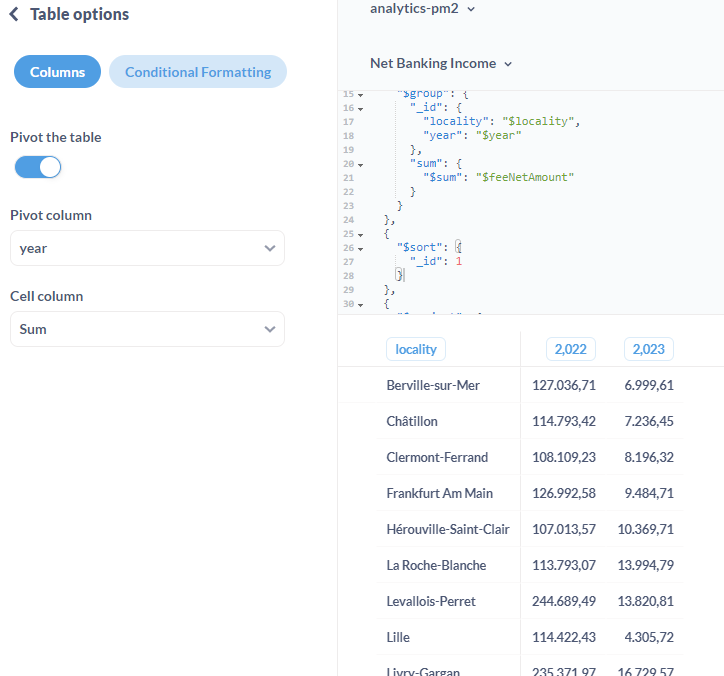
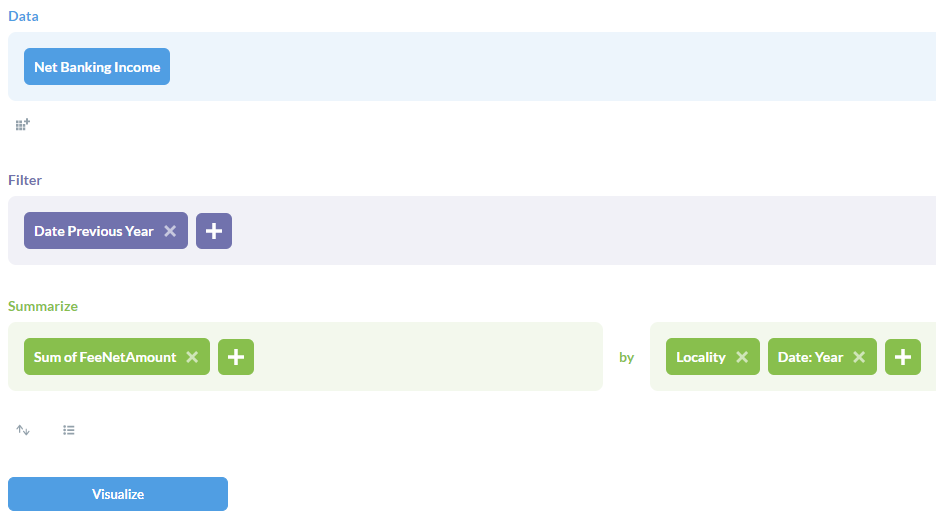
So far, I could easily display the 3 first columns, by doing this :

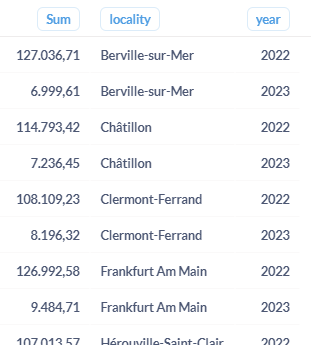
It gives me the following result :
image

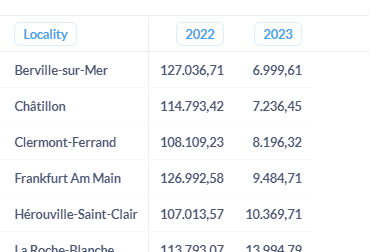
However, I can't find way to display the last column with the trend. When I try to select the Trend option in the visualization settings, I have an error message "Group by a time field to see how this has changed over time" (although my data is grouped by year). If I remove the locality in the 'group by' options, it works but it's not what I want since I don't have anymore the details per locality.

Is there a way I can achieve this ?

Thank you in advance !

Hey, you can do this using custom expressions.

Basically, you will need to create three custom columns:

  1. Sum in 2022
  2. Sum in 2023
  3. Sum in 2023 / Sum in 2022

There is a full tutorial here. Let me know if this helps!

By the way, agree that the trend viz has a confusing name. It actually refers to a single "delta" like this. I will pass your feedback on to the product team. :slight_smile:

1 Like

Hi,
Thank you for your anwer. I checked the tutorial, I understand how it could work, but the problem is that I use MongoDB, and custom expressions are not supported. This is a known topic : MongoDB support Custom Column and Custom Expression · Issue #7097 · metabase/metabase · GitHub

I'm trying to do it by using native queries, but I'm new in Mongodb language, and so far I didn't find how to do it.

Currently, I have the following query, in which I hardcoded the 2 years for which I want to compare the sums of amounts per locality (the next step will be to use a custom filter for the year, but I use hardcoded values for now, just to make the query more simple and to focus on the main problem). Note that the field "year" is a pre-calculated number that corresponds to the year of another field in date format.

[
  {
    "$match": {
      "$or": [
        {
          "year": 2022
        },
        {
          "year": 2023
        }
      ]
    }
  },
  {
    "$group": {
      "_id": {
        "locality": "$locality",
        "year": "$year"
      },
      "sum": {
        "$sum": "$feeNetAmount"
      }
    }
  },
  {
    "$sort": {
      "_id": 1
    }
  },
  {
    "$project": {
      "_id": false,
      "locality": "$_id.locality",
      "year": "$_id.year",
      "sum": true
    }
  },
  {
    "$sort": {
      "locality": 1,
      "year": 1
    }
  }
]

This gives me the following output
image

Actually, I would like to pivot the results on the year, so that I have one column '2022' and one column '2023', like this

I can do that easily by using the pivot option in the settings of the table visualization. However, I would like to be able to do it directly in the native query, so that afterwards I could add a new column (with an "addFields" block added in the aggregation pipeline) containing an computation based on the 2 other columns (2022 and 2023).
But so far I can't find how I can do that.

Does anyone has an idea ?