gabi
September 7, 2021, 4:21pm
1
I've been trying to use the trends visualization and it works pretty well when the query is grouped by month or day.
Thank you in advance
1 Like
flamber
September 7, 2021, 6:08pm
2
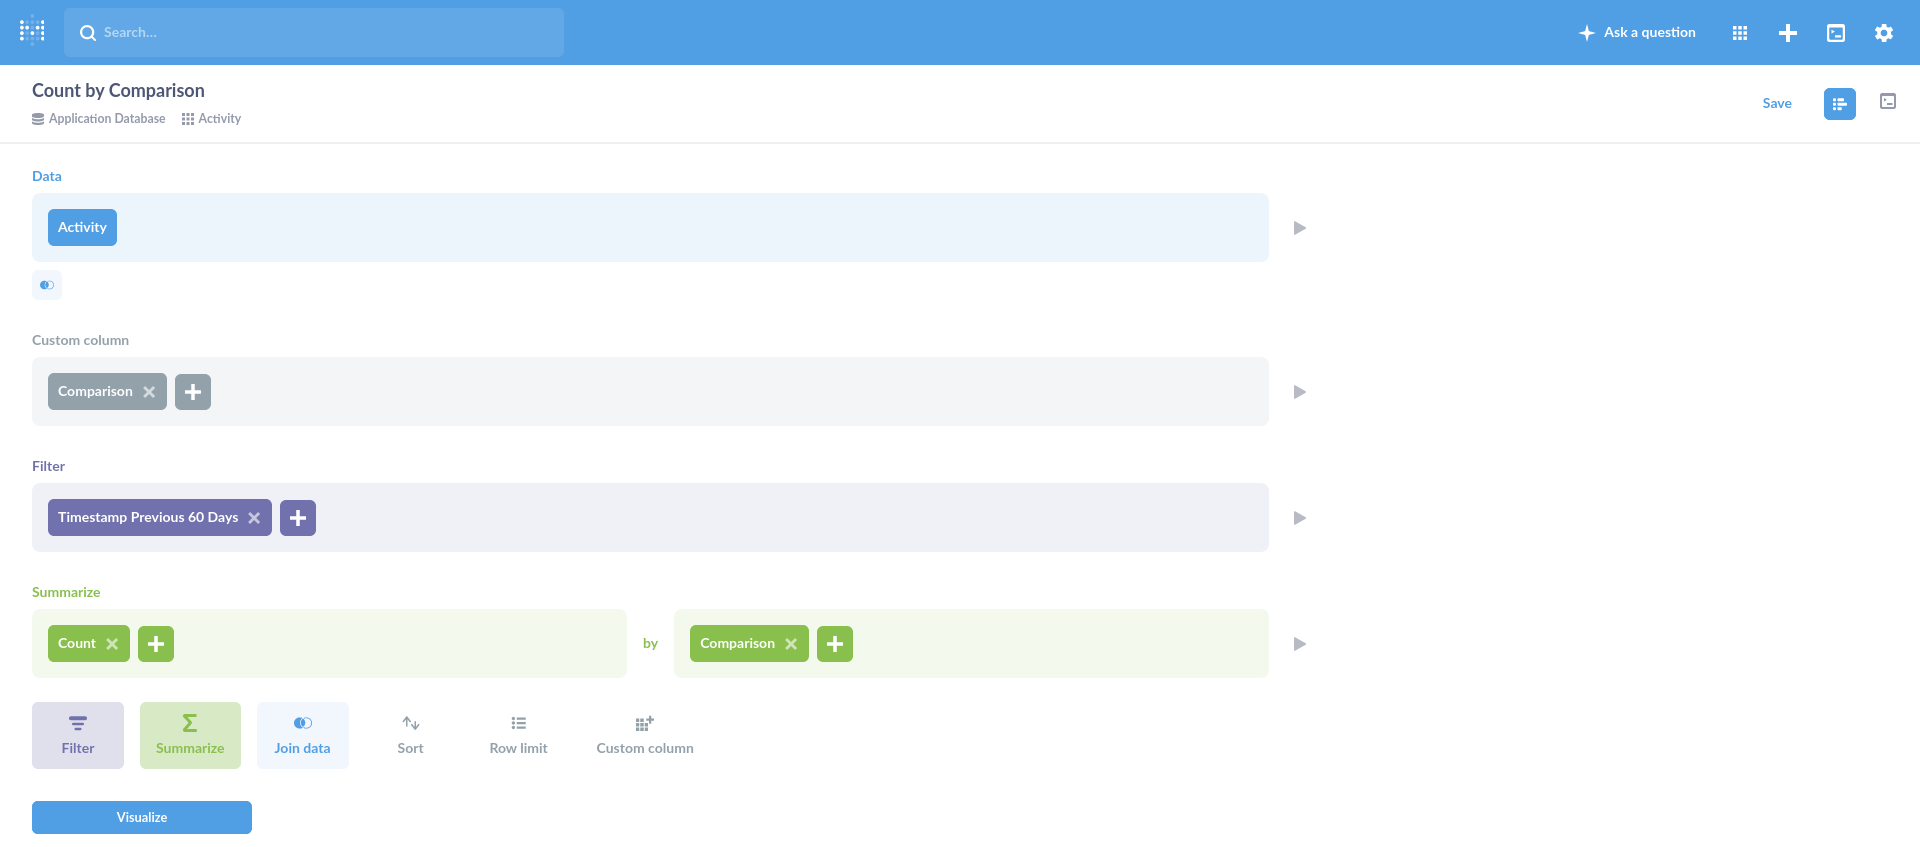
Hi @gabi Sliding windows in MBQL · Issue #9393 · metabase/metabase · GitHub
Where the Custom Column is like this:
case(interval([Timestamp], -30, "day"), "Last 30 days", interval([Timestamp], -60, "day"), "Last 60 days")
2 Likes
toink
September 7, 2021, 8:04pm
3
I build a view table in my Mysql database to solve this, but i'll try your example, too.
Edit: @flamber Do you also have a tip to create an overlapping line graph's showing values from today to -30 days, compared to -30 days to -60 days?
1 Like
flamber
September 7, 2021, 8:56pm
4
@toink That's currently not possible. You would have to use hours or minutes instead.https://github.com/metabase/metabase/issues/12457 - upvote by clicking
1 Like
 on the first post