Hi All,
Really enjoying exploring this product but having some issues creating a chart with multiple summarize by columns. For context, I'm analyzing DC Moving Violations data, it's loaded in a local postgresql database and I'm running metabase locally with
docker run -e "JAVA_TOOL_OPTIONS=-Xmx2048m" -p 3000:3000 --name metabase metabase/metabase
When summarizing the data by one column (either issue_date or violation_code), everything looks okay:

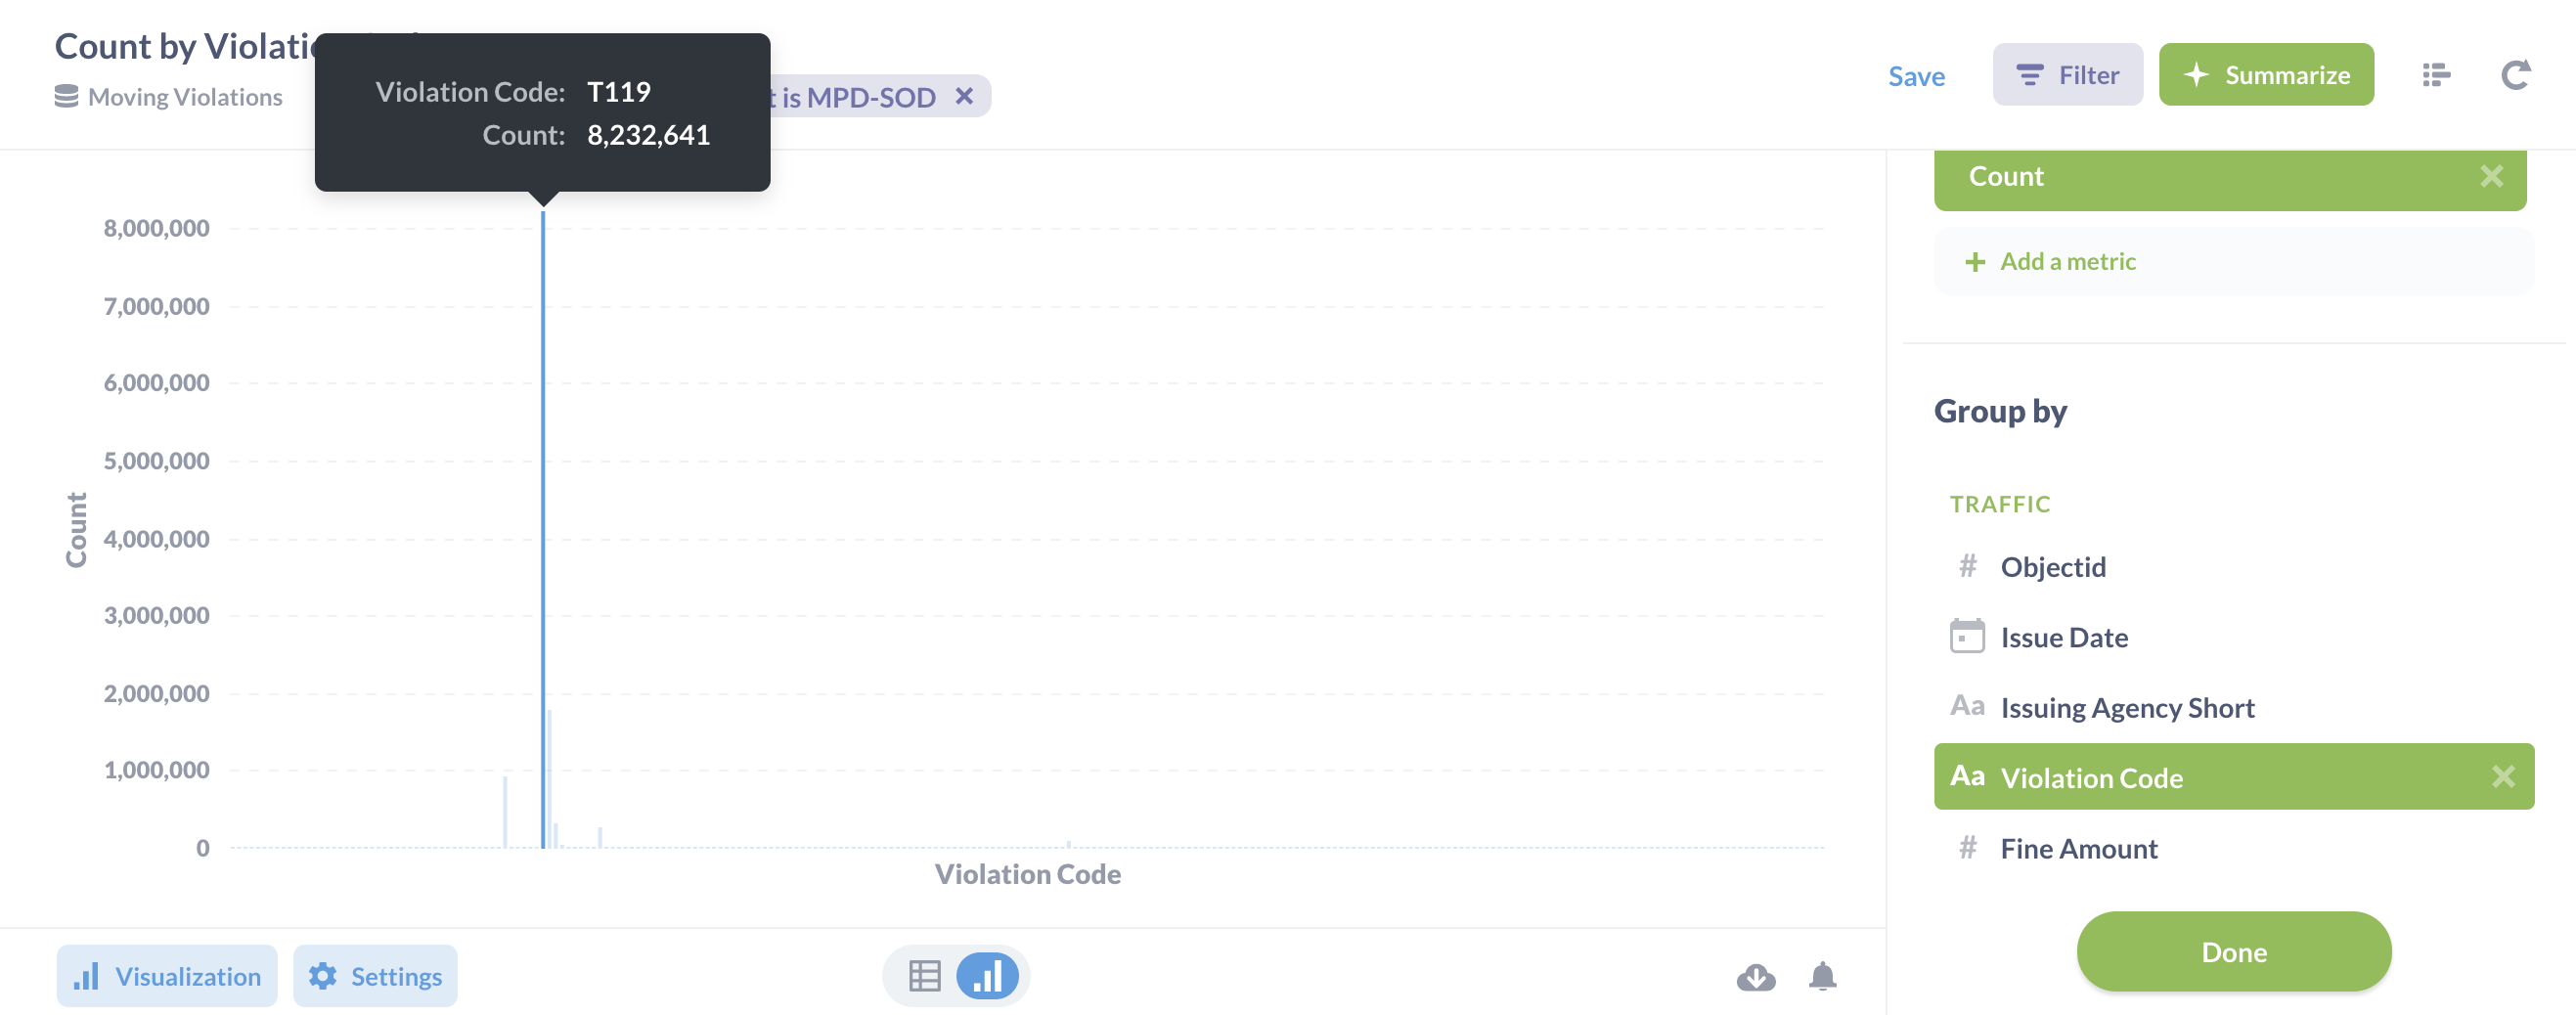
But when summarizing by both, the graph seems to "bail early" and stop showing data for T119 (speeding 11-15 mph) after 2011. The graphs are different depending upon the order of the summarize by statements:
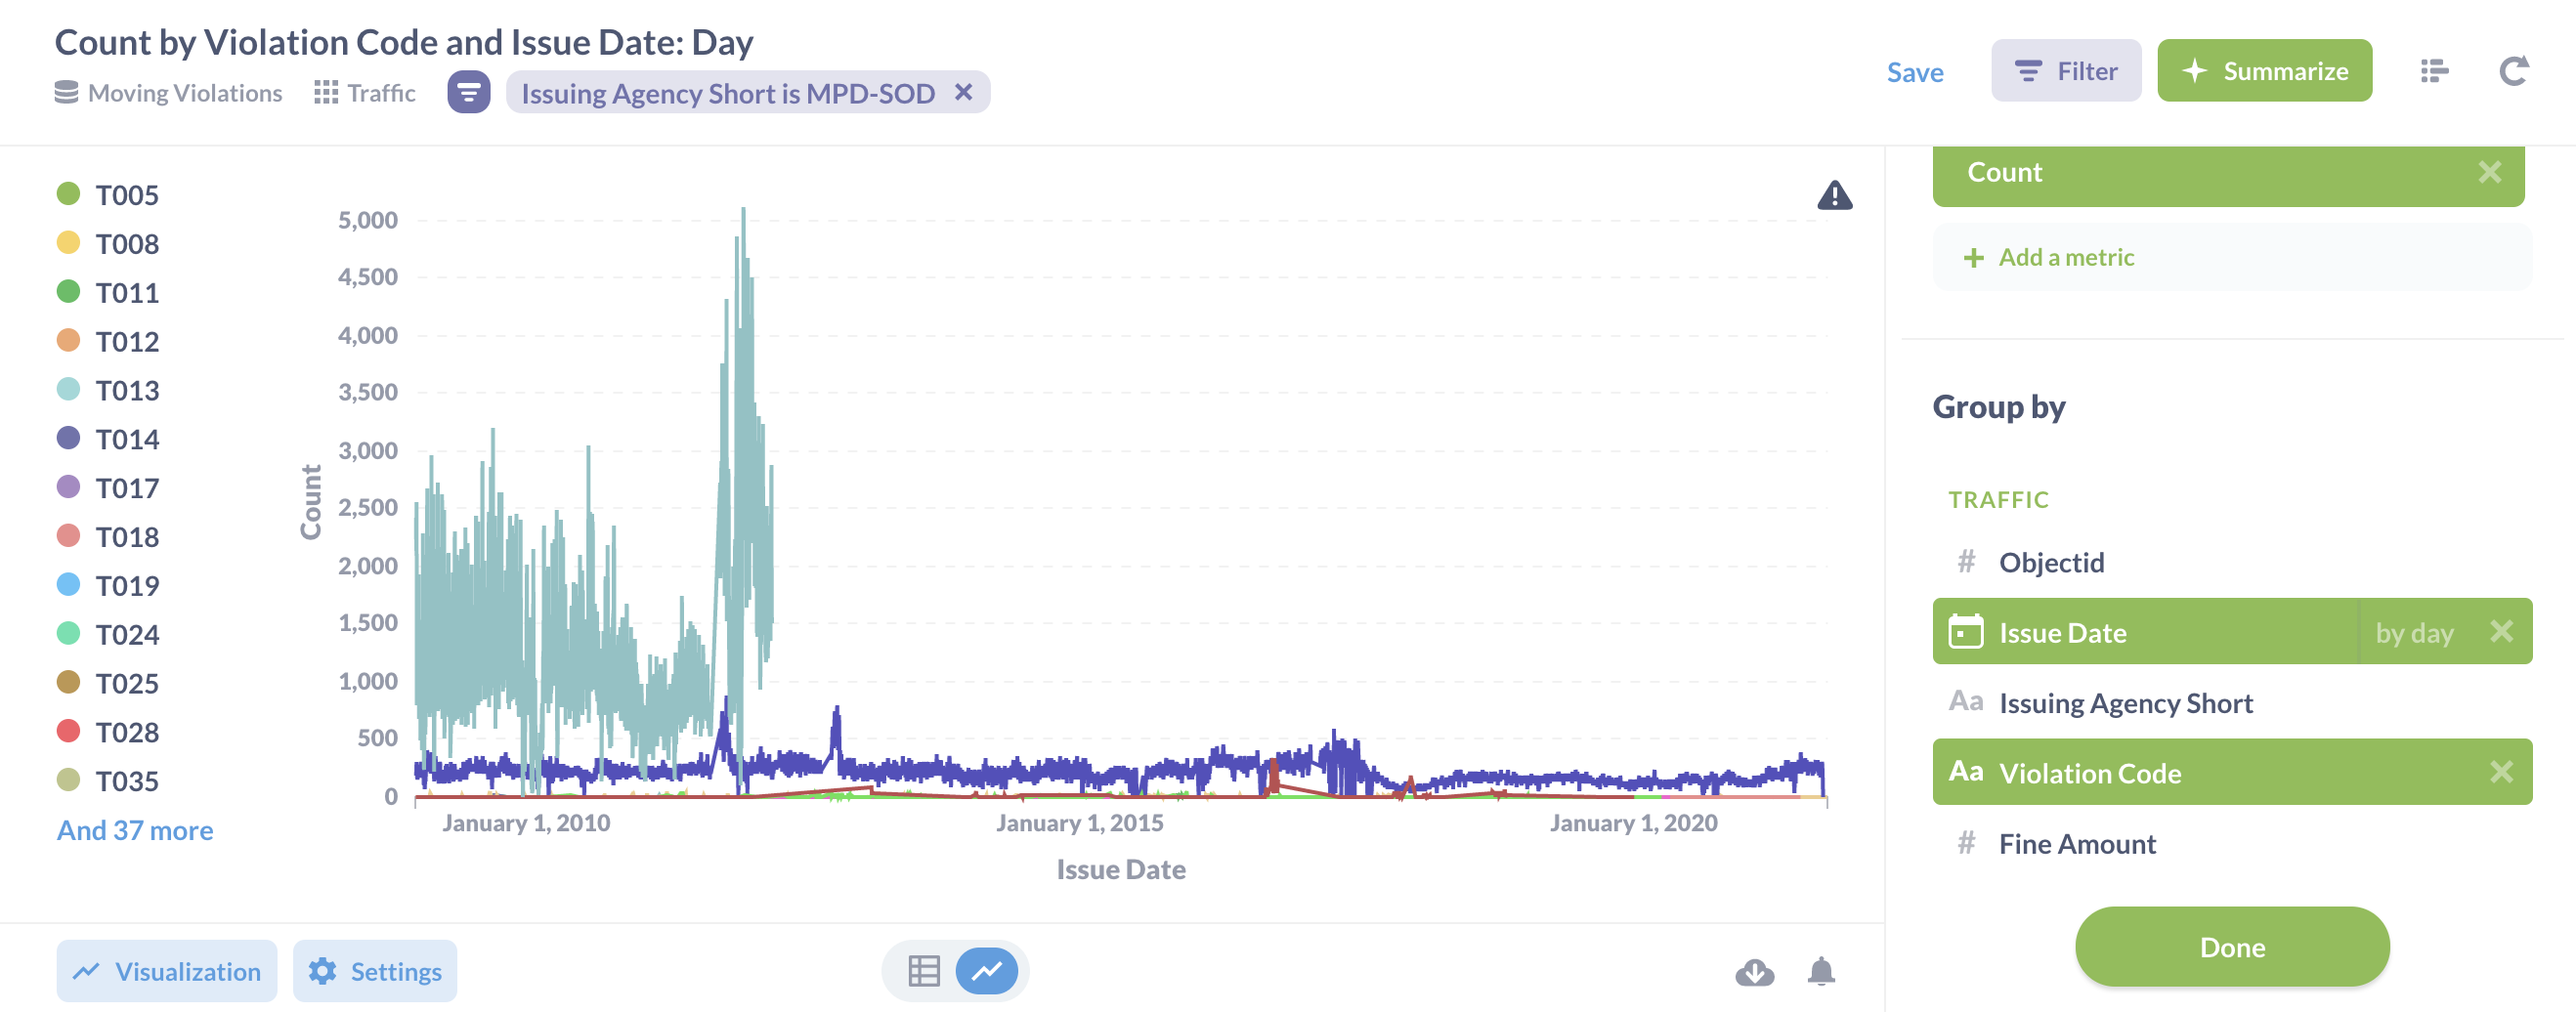
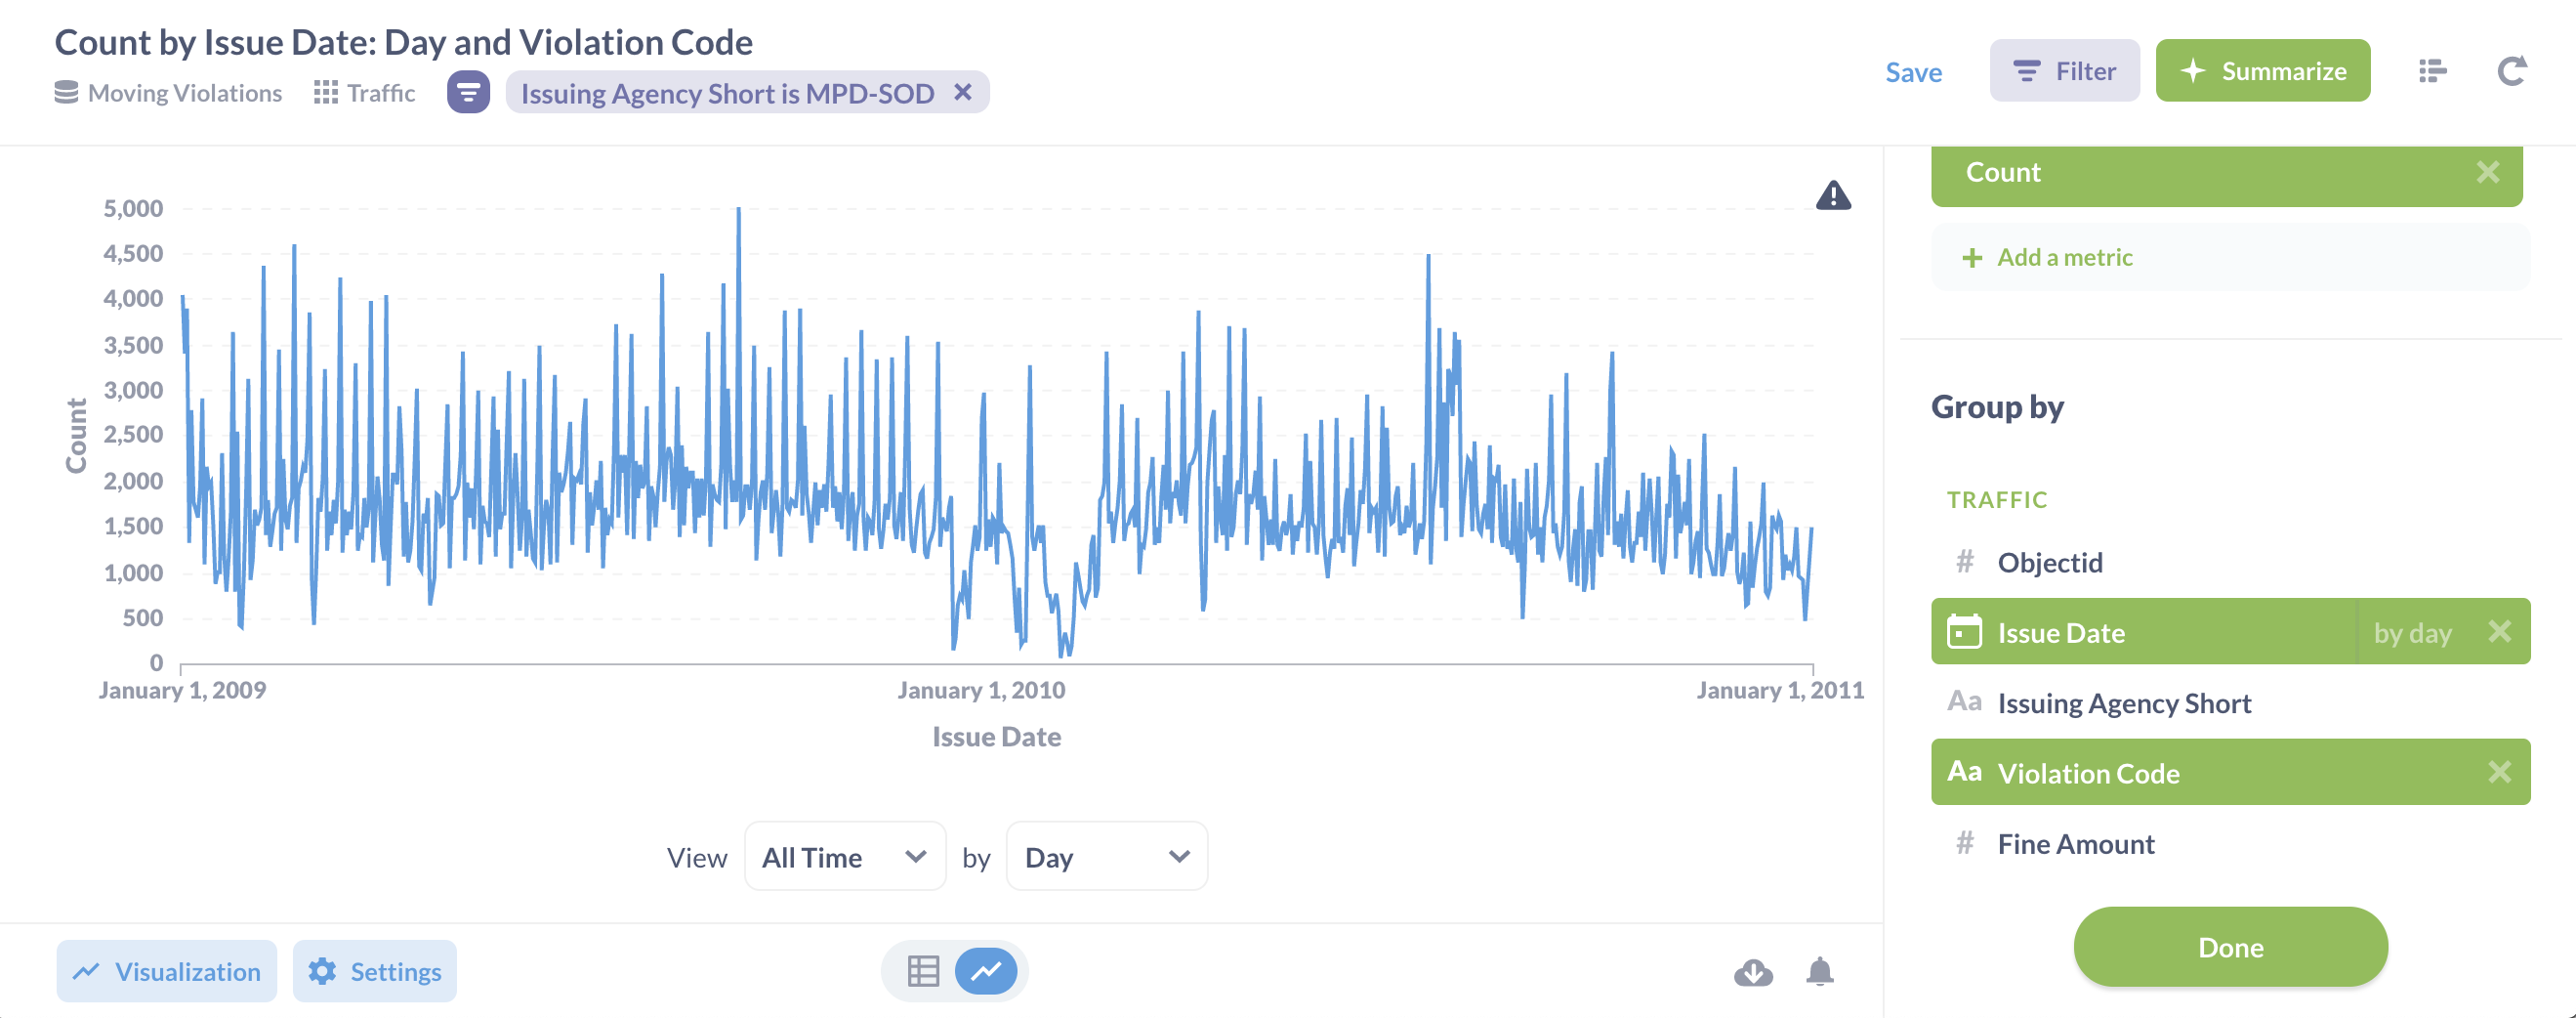
The first graph is roughly correct (violations as the series) except that it stops graphs T119 early and doesn't allow for regrouping the time axis. The second graph truncates the entire data range to match the short time frame.
Any thoughts on why this is occurring or ideas to troubleshoot? Thanks,
Drew
 on the first post