I have a chart that looks like this on Excel:
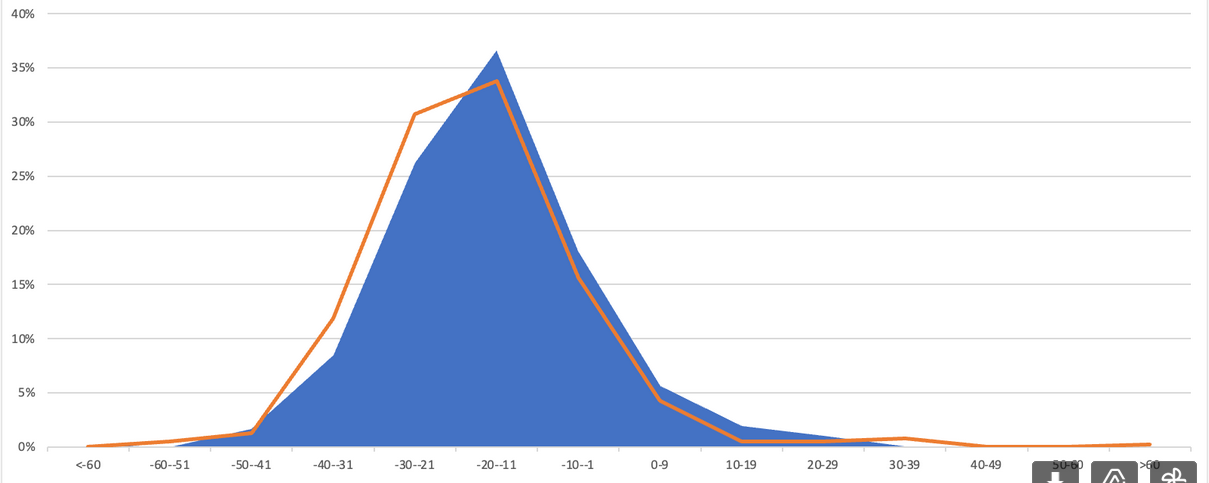
The orange line is of a date range X to Y; the blue area chart is of a date range A to B. These date ranges do not overlap and I want them to be two separate filters.
Is this possible? My summary is basically to calculate the: COUNT of a category and GROUPED BY the bin ranges (see the x-axis).
Thanks for the help community.
Kind regards,
Christian NW