Hi! I want use two variables in axis X : "Category" and "Status". Status in distinct colours, and each bars are the categories. In the axis "Y" content the counts.
The problems is presents when i need use limits = 10, because only show the first 10 rows in the SQL then dont show the resume of complete table.
In conclusion, i need cut the next graphic for only 10 first bars, and get the top ten:

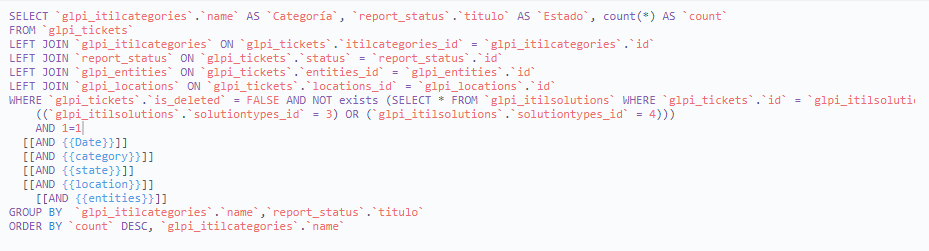
My code: