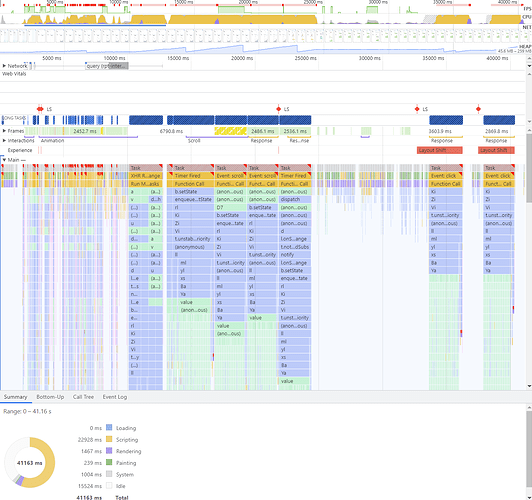
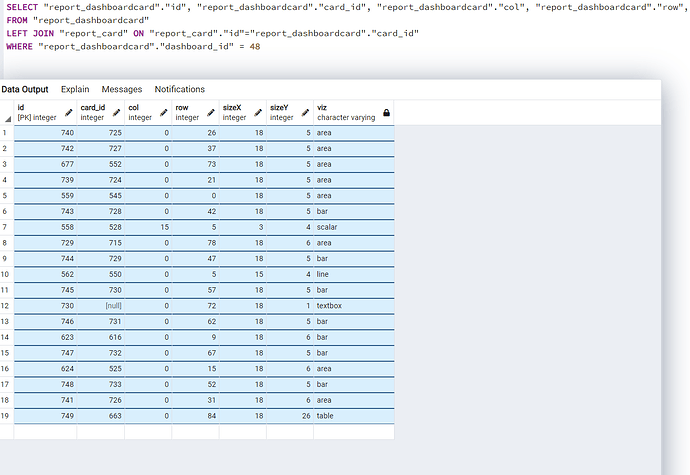
Last night I upgraded from 43.2 to 42.1. I have a report that has about 19 cards on it. It relatively quickly loads 18 of the 19 cards as stated in the browser tab but then the last lab tab takes quite a while to load. I am not able to scroll up and down for about one to two minutes until it fully loads. Once it fully loads I can scroll up and down but the general UI for Metabase is almost unresponsive. If I try to click a button or something else in the application it takes 5 to 10 seconds to respond. I have tried this on a few different computers Mac and PC. The PC has 32 gigs of ram so I'm not sure that this is a ram issue. Also, I'm using the latest version of chrome. I tried Firefox on the PC and had a similar issue. It feels like a client-side issue but this report has been running fine for six months. Even after it fully loads if I go back to the browser it has delayed scrolling and delayed interaction. Almost like my computer is short on resources.
The only thing that changed yesterday was the upgrade. I removed the long-running report card and it still takes quite a while to load. Some cards don't populate very quickly with the bar charts as they used to. No significant changes in underlying data. Any thoughts?
It is running in AWS on beanstalk with Postgres config db hitting SQL Server sources. Below is the diagnostic info. I was running t3.small instance in RDS. Upgraded to t3.medium and no change in load performance.
{
"browser-info": {
"language": "en-US",
"platform": "MacIntel",
"userAgent": "Mozilla/5.0 (Macintosh; Intel Mac OS X 10_15_7) AppleWebKit/537.36 (KHTML, like Gecko) Chrome/102.0.0.0 Safari/537.36",
"vendor": "Google Inc."
},
"system-info": {
"file.encoding": "UTF-8",
"java.runtime.name": "OpenJDK Runtime Environment",
"java.runtime.version": "11.0.15+10",
"java.vendor": "Eclipse Adoptium",
"java.vendor.url": "https://adoptium.net/",
"java.version": "11.0.15",
"java.vm.name": "OpenJDK 64-Bit Server VM",
"java.vm.version": "11.0.15+10",
"os.name": "Linux",
"os.version": "4.14.276-211.499.amzn2.x86_64",
"user.language": "en",
"user.timezone": "GMT"
},
"metabase-info": {
"databases": [
"sqlserver"
],
"hosting-env": "unknown",
"application-database": "postgres",
"application-database-details": {
"database": {
"name": "PostgreSQL",
"version": "11.15"
},
"jdbc-driver": {
"name": "PostgreSQL JDBC Driver",
"version": "42.3.2"
}
},
"run-mode": "prod",
"version": {
"date": "2022-05-31",
"tag": "v0.43.2",
"branch": "release-x.43.x",
"hash": "433d533"
},
"settings": {
"report-timezone": null
}
}
}
}

