Hello!
Please help
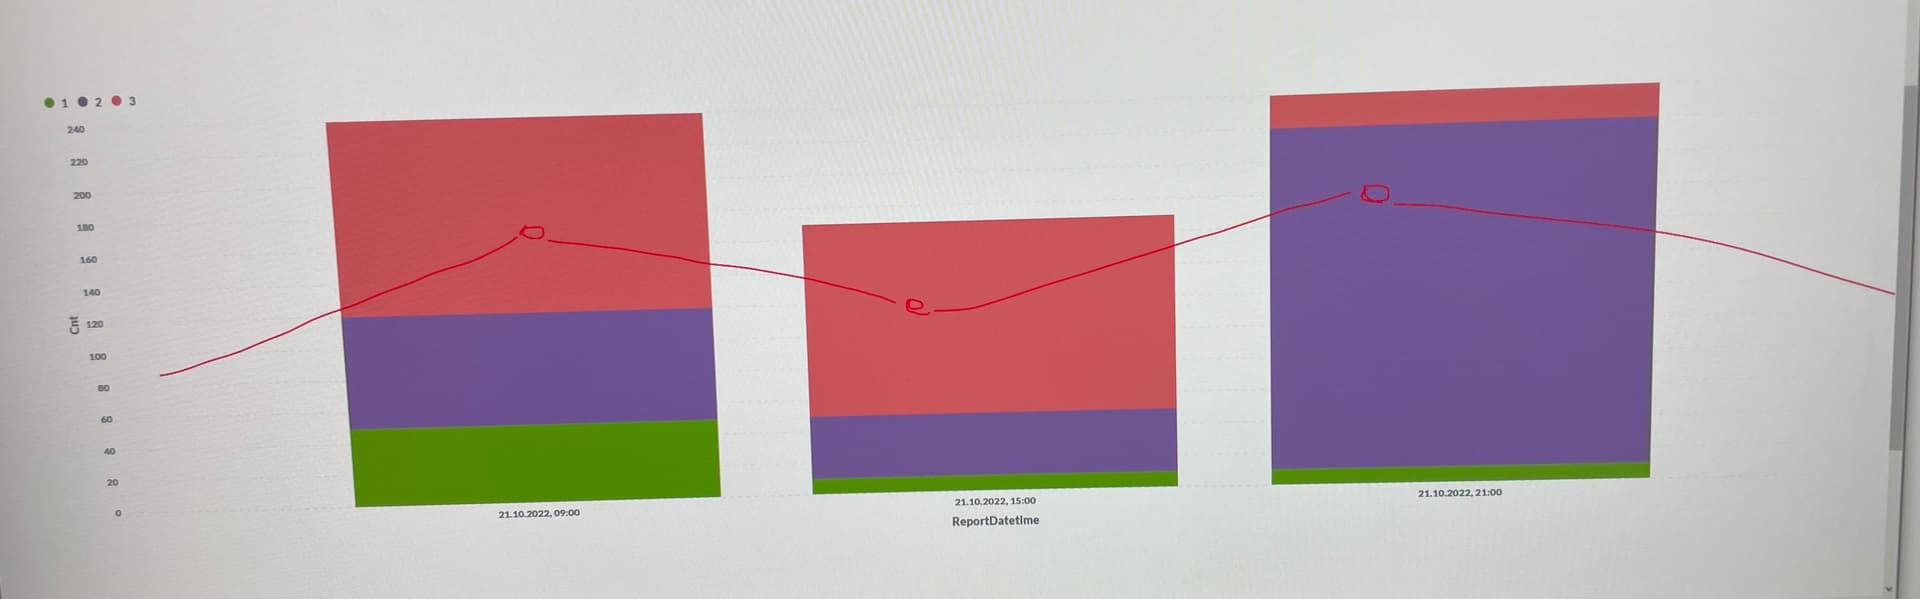
tell me how to do it like in the picture
the red line is the indicators for the last day (from the example ReportDate = 10/20/2022)
here is an example data
| NAME | ReportDate | ReportDatetime | Segment | Cnt |
|---|---|---|---|---|
| param | 20.10.2022 | 2022-10-21 09:00:00.000 | 1 | 70 |
| param | 20.10.2022 | 2022-10-21 15:00:00.000 | 2 | 60 |
| param | 20.10.2022 | 2022-10-21 21:00:00.000 | 3 | 80 |
| param | 21.10.2022 | 2022-10-21 09:00:00.000 | 1 | 50 |
| param | 21.10.2022 | 2022-10-21 15:00:00.000 | 2 | 40 |
| param | 21.10.2022 | 2022-10-21 21:00:00.000 | 3 | 20 |
| param | 21.10.2022 | 2022-10-21 09:00:00.000 | 2 | 70 |
| param | 21.10.2022 | 2022-10-21 09:00:00.000 | 3 | 120 |
| param | 21.10.2022 | 2022-10-21 15:00:00.000 | 3 | 120 |
| param | 21.10.2022 | 2022-10-21 15:00:00.000 | 1 | 10 |
| param | 21.10.2022 | 2022-10-21 21:00:00.000 | 1 | 10 |
| param | 21.10.2022 | 2022-10-21 21:00:00.000 | 2 | 210 |